San Francisco Bay Area Home Sales Fall 31.8 Percent in January from December 2016, Lowest Since February 2008
January 2017 Median Home Price $750,000, Up 2.7 Percent Y-o-Y
CALIFORNIA, MARCH 3, 2017 – January 2017 San Francisco Bay Area home sales fell a seasonally depressed 31.8 percent from December 2016 and were down 4.6 percent relative to January 2016. Sales this January was the lowest since February 2008.
“We expect home sales to be low this time of year reflecting a seasonal sales lull around the holidays,” said Madeline Schnapp, Director of Economic Research for PropertyRadar. “But the rise in rates late last year likely helped push sales to the lowest levels since February 2008."
“Looking at sales by county revealed that sales fell in all six San Francisco Bay Area counties,” said Schnapp. “It’s no surprise that the three worst-performing counties were the three least affordable. San Francisco, San Mateo, and Marin counties all have median home prices exceeding $1 million.”
San Francisco Bay Area Home Sales Summary by County
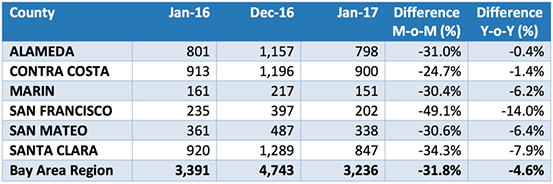
Source: PropertyRadar, 2017
Annual sales totals eliminate seasonal effects and provide a more accurate picture of sales trends. In 2016, Bay Area sales fell 9.4 percent from 2015. At the county level, sales fell in all six Bay Area counties ranging from a decline of 6.5 percent in San Mateo County to a decline of 12.6 percent in Marin County.
Annual sales totals eliminate seasonal effects and provide a more accurate picture of sales trends. In 2016, Bay Area sales fell 9.4 percent from 2015. At the county level, sales fell in all six Bay Area counties ranging from a decline of 6.5 percent in San Mateo County to a decline of 12.6 percent in Marin County.
"January sales were likely impacted by the jump in mortgage interest rates late last year," said Schnapp. "Taking a longer-term look, Bay Area sales in 2016 were nearly 10 percent lower than they were in 2015 while prices rose. That tells us that there is a significant imbalance between supply and pricing.”
San Francisco Bay Area Home Sales Summary by County (Annual Totals)
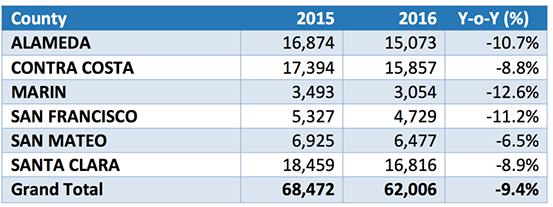
Source: PropertyRadar, 2017
When annual sales are divided into price categories, sales of properties whose sale prices were $500,000 or less fell 24.6 percent year-over-year while sales in the $1 million-plus category increased by 1.5 percent.
“A low-priced home in much of the Bay Area is now considered to be $500,000 or less. Sales of those properties fell 24.6 percent as prices march steadily higher,” said Schnapp. “Surprisingly, the only price category that saw an increase in sales were properties that sold for more than $1 million. Those types of numbers are not indicative of a healthy or sustainable housing market given current income levels and wage trends.”
San Francisco Bay Area Home Sales by Price Category, Annual Comparison
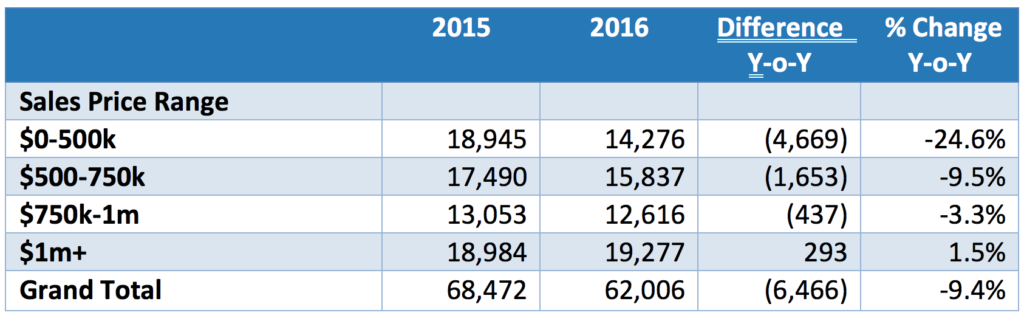
Source: PropertyRadar, 2017
The January 2017 San Francisco Bay Area median home price (single-family residence) was $750,000, down 5.1 percent from $790,000 in December 2016 but up 2.7 percent from $730,000 a year earlier. Since January 2016, median prices were up in all six counties with annual price increases ranging from a low of 2.4 percent in San Francisco County to a high of 27.9 percent in Marin County. The January 2017 median prices in three of the six Bay Area counties, Marin, San Francisco, and San Mateo, exceeded $1 million.
Bay Area Median Price Summary by County (Single Family Residence)
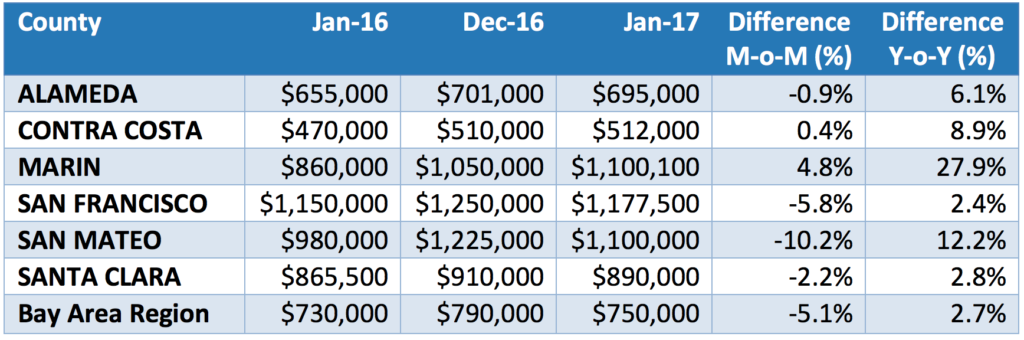
Source: PropertyRadar, 2017
Cash sales of Bay Area homes remain elevated but continue to trend lower as prices rise. In January 2017, 575 homes sold for cash, up 1.6 percent from 566 cash sales a year earlier. Cash sales represented 17.8 percent of total sales, high by historic norms of 5 to 6 percent of total sales, but well below peak cash sales of 26.3 percent in 2011.
For the year, 2016 Bay Area cash sales fell 16.7 percent from 2015 but remained elevated as a percent of total sales in several Bay Area counties. While in Alameda County cash sales as a percent of total sales were 14.8 percent, in two of the most expensive counties in the Bay Area, Marin and San Francisco, cash sales represented 24.5 and 26.2 percent of total sales, respectively.
“Even in the most expensive region of California, cash sales continue to be an important component of total sales,” said Schnapp. “That being said, cash sales as a percent of total sales, continue to decline as home prices rise. Given the elevated risk in the stock and bond markets and the uncertain trajectory of mortgage interest rates in 2017, parking cash in real estate now remains an attractive alternative to a certain class of investor.”
“Economic growth in the first half of 2017 is expected to remain tepid with the balance of 2017 uncertain,” said Schnapp. “Until the tax and trade policies of the new administration become clearer, we believe our ‘Flat is the New Black’ market perspective for 2017 will remain intact.”
San Francisco Bay Area Home Sales January Year-over-Year (6-County Region)
San Francisco Bay Area Year-over-Year Home Sales - Single-family residences and condominiums sold during the same month for the current year and prior years divided into distressed and non-distressed sales.
San Francisco Bay Area Home Sales in January 2002-2016
San Francisco Bay Area Year-to-Date Home Sales – The sum of January through September sales of single-family residences and condominiums for the current year and prior years divided into distressed and non-distressed property sales. Six San Francisco Bay Area county totals are included in this chart (Alameda, Contra Costa, Marin, San Francisco, San Mateo and Santa Clara).
San Francisco Bay Area Median Home Prices
Median Sales Price – Median sales price of a single-family home by county in the six San Francisco Bay Area counties (Alameda, Contra Costa, Marin, San Francisco, San Mateo and Santa Clara).
San Francisco Bay Area Annual Cash Home Sales
San Francisco Bay Area Cash Sales - The blue bars (right axis) illustrate cash sales of single-family residences and condominiums by month. The red line (left axis) illustrates cash sales as a percentage of total sales by month.
PropertyRadar Report Methodology
California real estate data presented by PropertyRadar, including analysis, charts, and graphs, is based upon public county records and daily trustee sale (foreclosure auction) results. Items are reported as of the date the event occurred or was recorded with the California County. If a county has not reported complete data by the publication date, we may estimate the missing data, though only if the missing data is believed to be 10 percent or less of all reported data.


