California Home Sales Not Drying Up
March Sales Jump 33.1 Percent From February,Median Price Gains 4.8 Percent
March 2015 California single-family home and condominium sales were 31,989, a 33.1 percent jump from 24,031 in February, the biggest March increase in three years. Driving the increase in sales was the 36.7 percent increase in non-distressed property sales for the month. Non-distressed property sales in March represented 82.8 percent of total sales, up from 79.7 percent a year earlier and a low of 24.3 percent in January 2009.
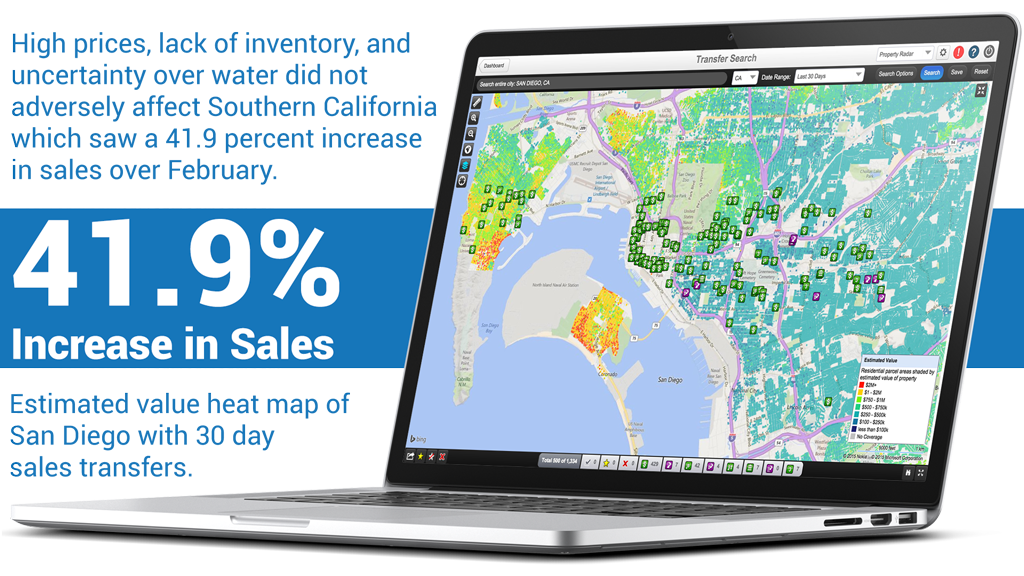
On a year-over-year basis, sales were up 8.8 percent from 29,617 in March 2014. Regionally, March sales gained 27.2 percent across the nine Bay Area counties, 41.9 percent in Southern California, and 17.7 percent in Central California.
“For the first time in 16 months, sales were higher than a year earlier,” said Madeline Schnapp, Director of Economic Research for PropertyRadar. “Pent-up demand, mild winter weather and attractive interest rates have created a wellspring of California housing market sales. Despite the California drought dominating headlines, we aren’t seeing data that suggests the drought is having a negative impact on the market. Obviously we’ll continue to monitor that closely.”
The median price of a California home was 393,000 dollars in March, a gain of 18,000 dollars, or 4.8 percent, from 375,000 dollars in February. For the month, median prices rose in 17 of California’s largest 26 counties. On a year-over-year basis, the median price of a California home was up 4.9 percent.
“After eight months of flat to declining prices, the surge in March sales was enough to push prices significantly higher,” said Schnapp. “Affordability, particularly in California’s sought after coastal areas, has become a big problem. The median income homebuyer in these areas can no longer afford to buy the median priced home. While inventory indicators seem generally favorable, you’d be hard pressed to find buyers who are not complaining of a lack of available homes for sale.”
March Foreclosure Starts, Notices of Default (NODs), were nearly unchanged from February but were down 15.5 percent in the past 12 months. Meanwhile, Notices of Trustee Sale jumped 17.5 percent from February to its highest level since October 2014. Foreclosure Sales fell 6.8 percent for the month and were down 21.3 percent in the past 12 months.
“The surge in Notices of Trustee Sale may be indicative of renewed interest by financial institutions to liquidate foreclosure inventory in order to take advantage of prices nearing pre-crisis levels,” said Schnapp.
In other California housing news:
- Cash sales totaled 7,657 in March, up 23.5 percent from February and represented 23.9 percent of total sales. Despite the increase in sales this past month, cash sales as a percentage of total sales have been steadily declining since reaching a peak of 40.0 percent of total sales in August 2011. Since then, cash sales are down 46.0 percent. Cash sales were highest in San Francisco and San Mateo counties and lowest in San Diego and Solano counties.
- Flip sales totaled 1,057 in March, up 26.7 percent for the month but down 18.0 percent for the year. Flip sales are defined as properties that have been resold within six months. Flip sales comprised 3.3 percent of total sales in March, down 0.2 percent from February. Flip sales peaked in June 2013 at 4.7 percent of total sales and have declined 45.7 percent since then.
- March Institutional Investor LLC and LP purchases totaled 1,190, up 14.5 percent for the month and 0.8 percent from March 2014. Over the longer term, institutional investor demand has retreated due to the lower return on investment and dwindling supply of distressed properties for sale. Institutional purchases were down 46.4 percent since peaking in December 2012. Similarly, Trustee Sale purchases by LLC and LPs were down 82.9 percent from their October 2012 peak.
“As much as we would like to think otherwise, the March surge in sales is likely transitory,” said Schnapp. “High prices, lack of inventory, and uncertainty over water and snow are not going away anytime soon and will likely keep a lid on sales.”
Home Sales

Home Sales - Single-family residence and condominium sales by month from 2007 to current divided into distressed and non-distressed sales. Distressed sales are the sum of short sales, where the home is sold for less than the amount owed, and REO sales, where banks resell homes that they took ownership of after foreclosure. All other sales are considered non-distressed.
Year-over-Year Home Sales
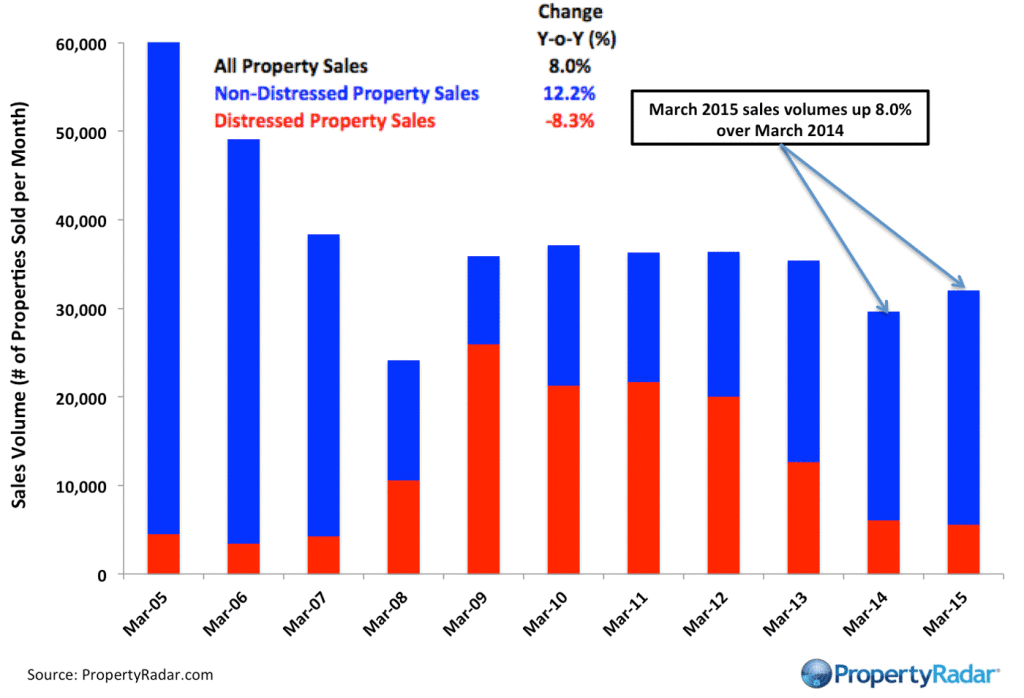
Year-over-Year Home Sales - Single-family residences and condominiums sold during the same month for the current year and prior years divided into distressed and non-distressed sales.
Median Sales Prices vs. Sales Volume
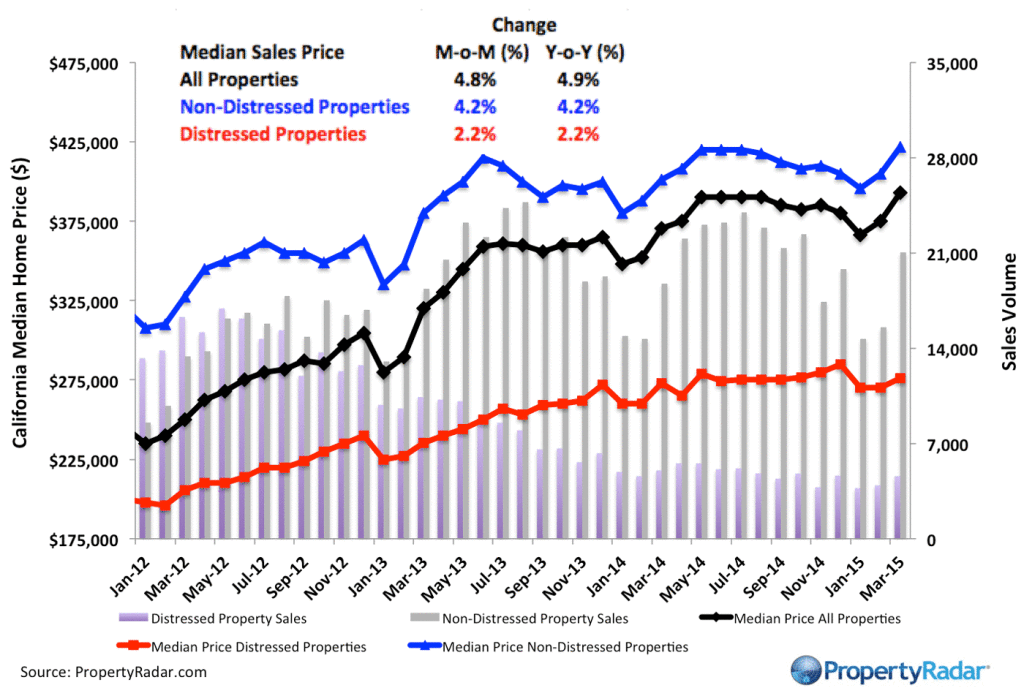
Median Sales Price vs. Sales Volume - Median sales price (left axis) of a California single family home versus sales volume (right axis), by month from 2012 to current. Median sales prices are divided into three categories: All single-family homes (black line), distressed properties (red line), and non-distressed properties (blue line). Monthly sales volumes (right axis) are illustrated as gray and lavender bars. The gray bars are distressed sales and the lavender bars are non-distressed sales.
California Homeowner Equity
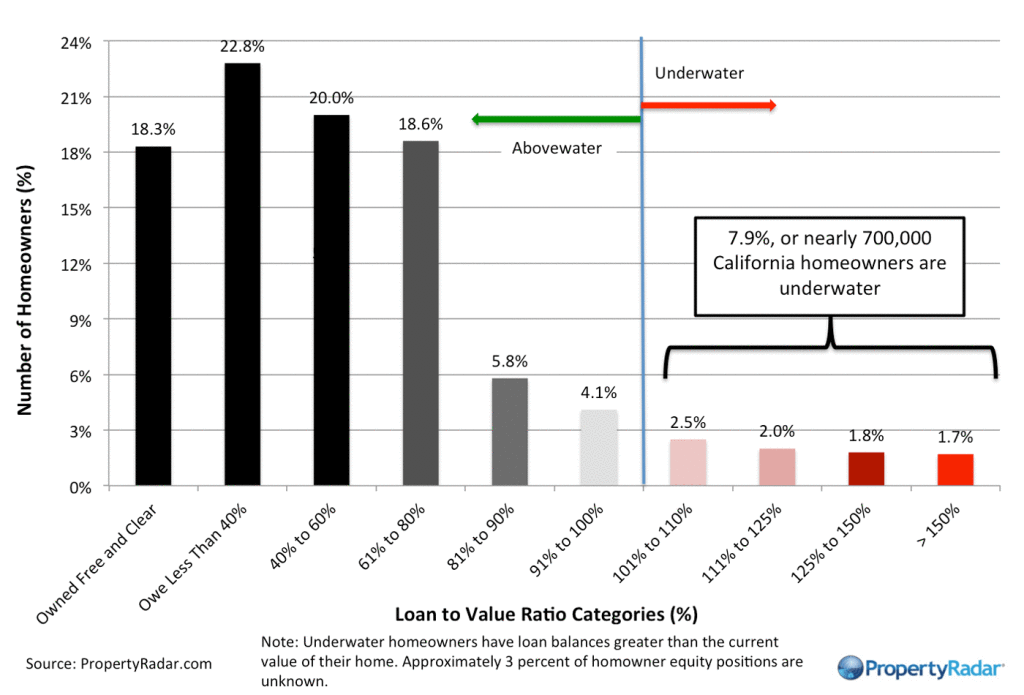
California Home Owner Equity - A model estimate of California homeowners segregated into various categories of levels of homeowner equity for a given month. Homeowner numbers represent a percentage of total California homeowners.
Cash Sales
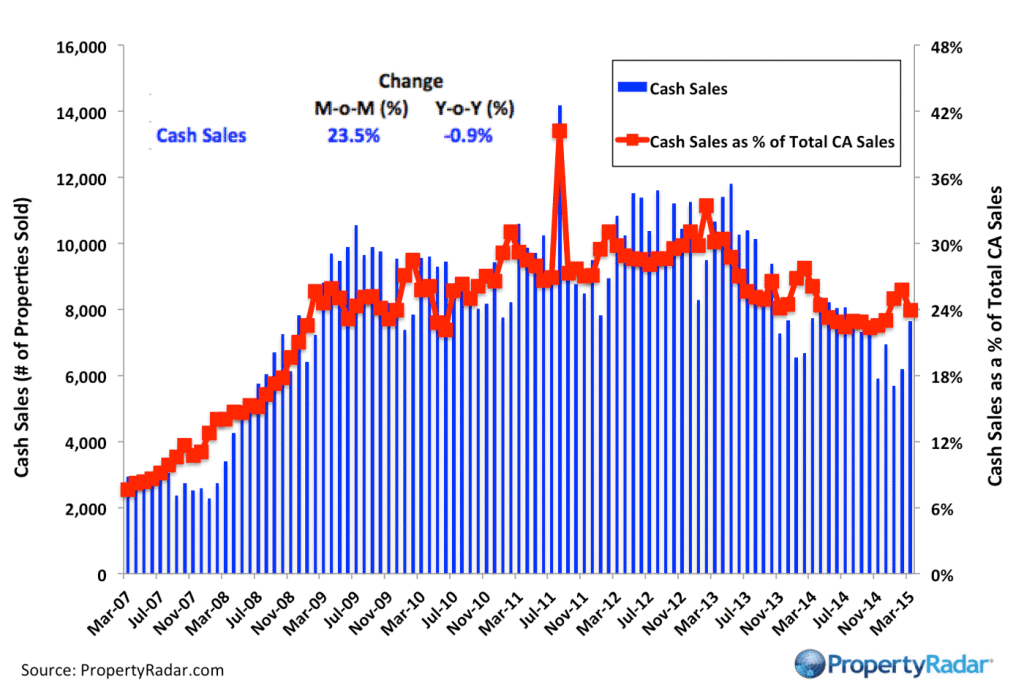
Cash Sales - The blue bars (right axis) illustrate cash sales of single-family residences and condominiums by month. The red line (left axis) illustrates cash sales as a percentage of total sales by month.
Flipping
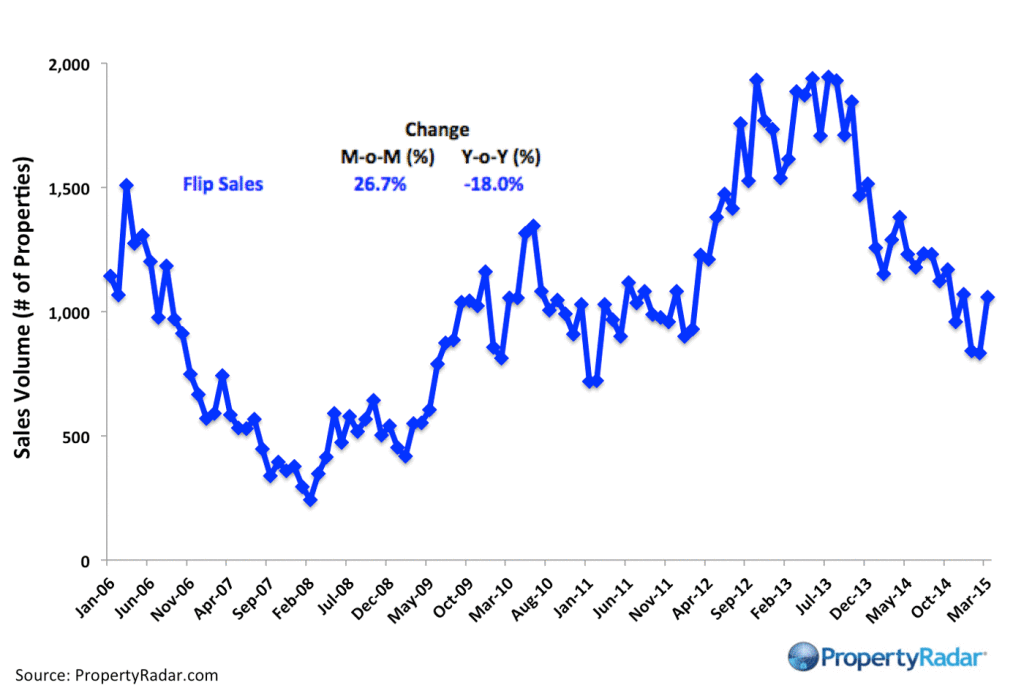
Flipping – The number of single-family residences and condominiums resold within six months.
Market Purchases by LLCs and LPs
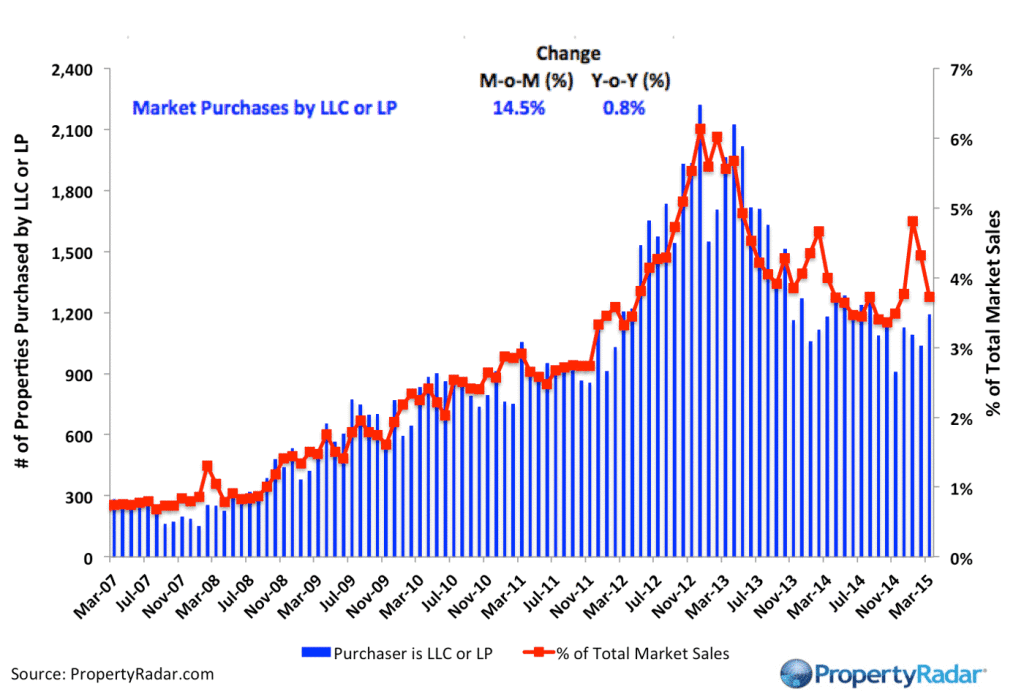
Market Purchases by LLCs and LPs - The blue bars (right axis) illustrate market purchases of single-family residences and condominiums by LLCs and LPs from 2007 to current. The red line graph (left axis) illustrates LLC and LP purchases as a percentage of total sales by month.
Market Sales by LLCs and LPs
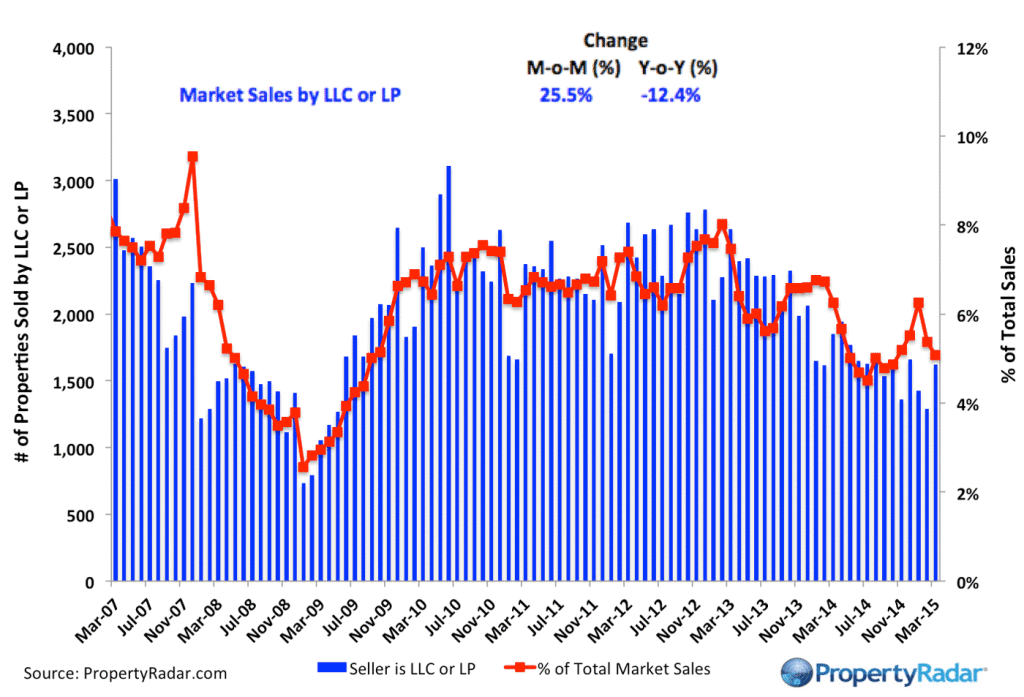
Market Sales by LLCs and LPs - The blue bars (right axis) illustrate market sales by LLCs and LPs of single-family residences and condominiums by month. The red line graph (left axis) illustrates sales as a percentage of total sales by month.
Trustee Sale Purchases by LLCs and LPs
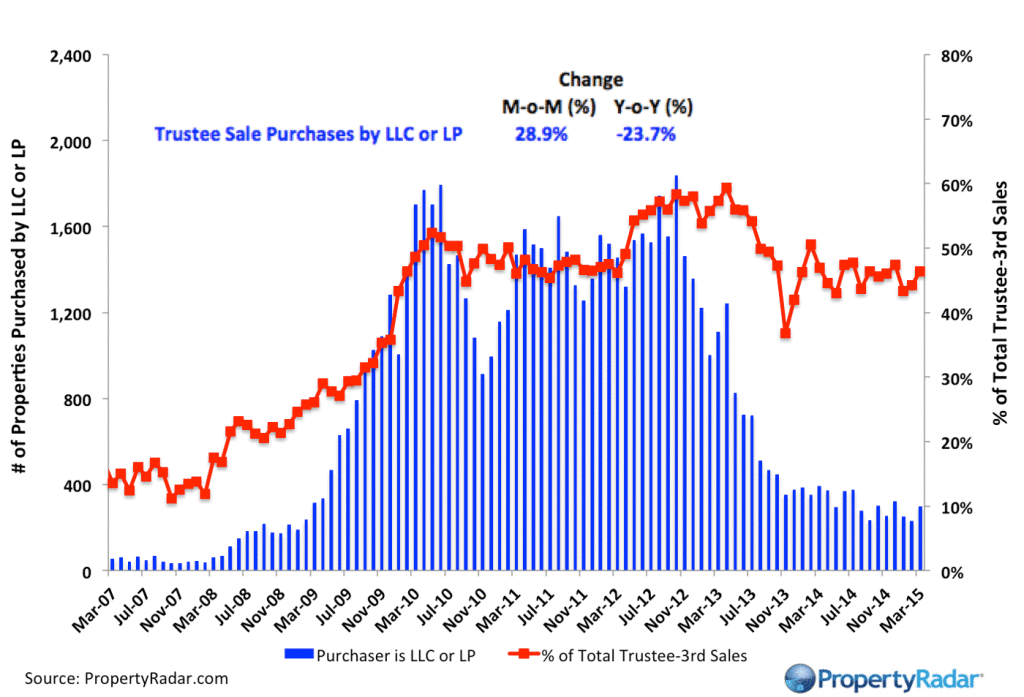
Trustee Sale Purchases by LLCs and LPs - The blue bars (right axis) illustrate trustee sale purchases (foreclosure sales) of single-family residences and condominiums by LLCs and LPs from 2007 to current. The red line graph (left axis) illustrates purchases as a percentage of total trustee sales by month.
Foreclosure Notices and Sales
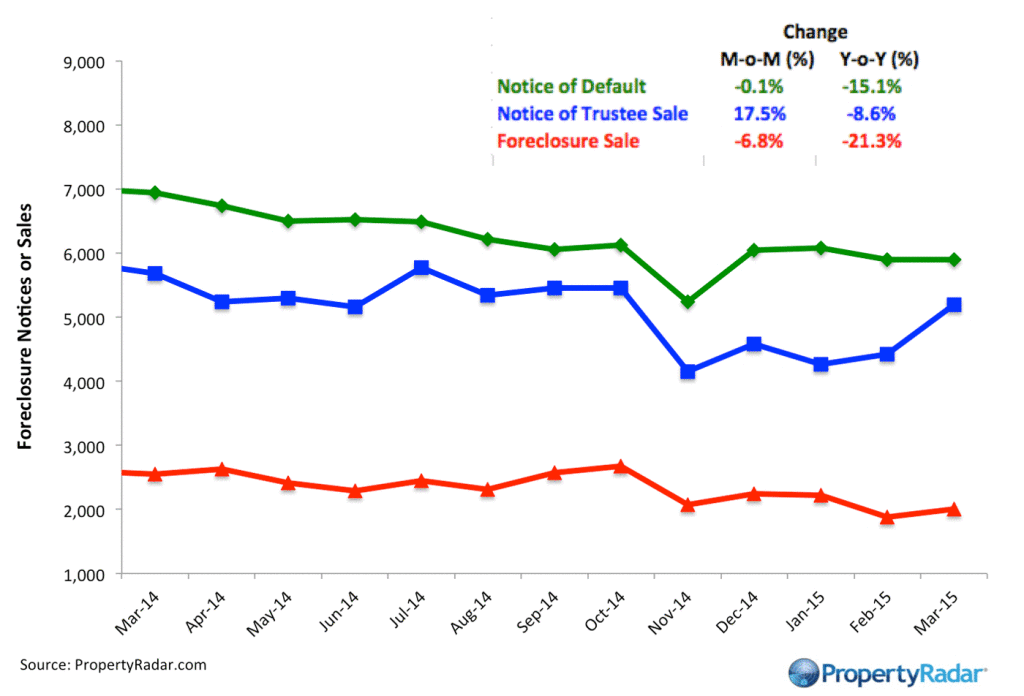
Foreclosure Notices and Sales - Properties that have received foreclosure notices — Notice of Default (green) or Notice of Trustee Sale (blue) — or have been sold at a foreclosure auction (red) by month.
Foreclosure Inventories
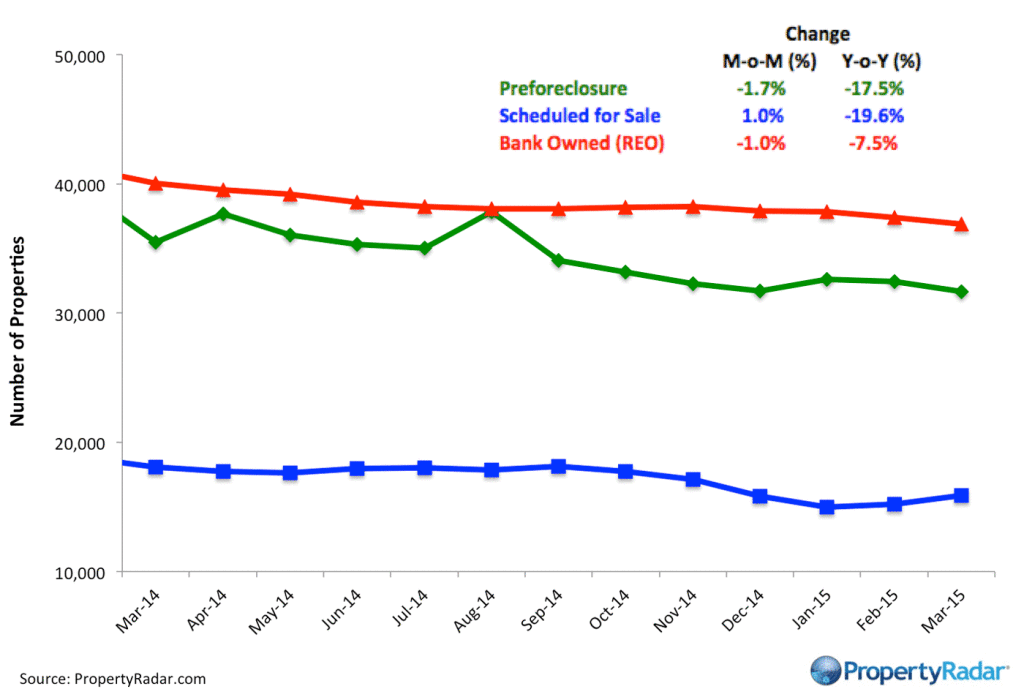
Foreclosure Inventory - Preforeclosure inventory estimates the number of properties that have had a Notice of Default filed against them but have not been Scheduled for Sale, by month. Scheduled for Sale inventory represents properties that have had a Notice of Trustee Sale filed but have not yet been sold or had the sale cancelled, by month. Bank-Owned (REO) inventory means properties sold Back to the Bank at the trustee sale and the bank has not resold to another party, by month.
Real Property Report Methodology
California real estate data presented by PropertyRadar, including analysis, charts, and graphs, is based upon public county records and daily trustee sale (foreclosure auction) results. Items are reported as of the date the event occurred or was recorded with the California County. If a county has not reported complete data by the publication date, we may estimate the missing data, though only if the missing data is believed to be 10 percent or less.


