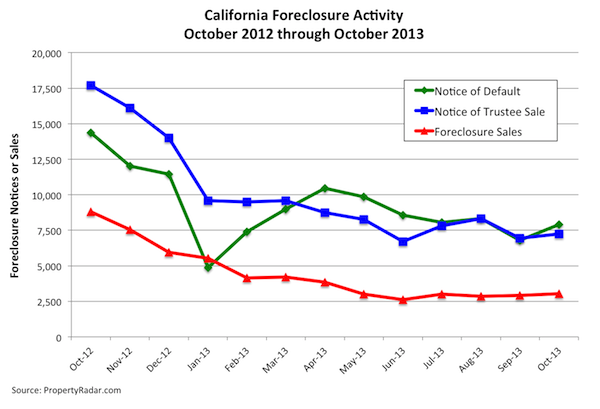
California foreclosure activity – Notices of Default, Notices of Trustee Sale and Foreclosure Sales – edged higher in October but has been trending mostly sideways since June at or below pre-housing crisis levels.
California Notices of Default jumped 15.3 percent in October, retracing some of the 19.5 percent drop in September but fell 45.2 percent in the past 12 months. Similarly, Notices of Trustee Sale gained 4.1 percent but dropped 59.2 percent for the year. Foreclosure sales gained 3.9 percent for the month but sank 65.4 percent for the year.
Splitting October foreclosure sales into their respective components — Sold to Third Party and Back to Bank (REO) — Sold to Third Party sales fell 2.1 percent in October and 63.8 percent over the past 12 months. Meanwhile, REOs have been steadily marching higher for four consecutive months as banks have resumed foreclosure sales following a temporary pause from mid-May to mid-July due to an Office of the Comptroller of the Currency (OCC) guidance letter that specified minimum standards for handling borrower files subject to foreclosure. REOs gained 7.6 percent in October and have jumped 64.2 percent since June but have fallen 63.8 percent over the past 12 months.
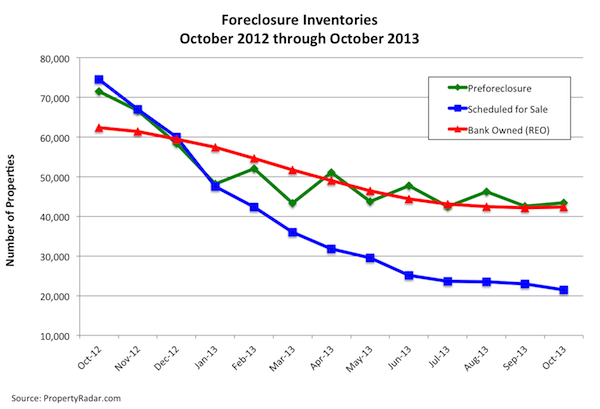
Foreclosure inventories have been trending mostly sideways since July, mirroring the trends in foreclosure notices and sales. Preforeclosure inventories gained 2.7 percent for the month but fell 38.8 percent in the past 12 months. Scheduled for Trustee Sale inventory fell 6.7 and is down 71.2 percent for the year. Bank Owned (REO) inventory was nearly unchanged, edging up 0.3 percent in October but declining 32.2 percent for the year.
While the low level of foreclosures seems to be good news, the reality remains that 1.5 million California homeowners are underwater and at risk of default. The numerous laws that either prevent or delay foreclosures thwart economic growth by trapping homeowners with negative equity. Negative equity, in turn, prevents underwater homeowners from selling an existing home or buying another, which keeps much-needed for-sale inventory off the market.
October Foreclosure Stats & Trends, by State
For a complete summary of October foreclosure stats and trends for California, Arizona, Nevada, Oregon and Washington, please click on the following links:
Note: The numbers in parentheses indicate over-the-month changes.
California foreclosure stats and trends
Foreclosure starts: 7,869 (+15.7%)
Foreclosure sales: 3,044 (+3.9%)
Foreclosure Inventories: 42,332 (+0.3%)
Arizona foreclosure stats and trends
Foreclosure starts: 2,151 (+6.8%)
Foreclosure sales: 1,277 (+6.9%)
Foreclosure Inventories: 11,751 (+1.0%)
Nevada foreclosure stats and trends
Foreclosure starts: 880 (-82.5%)
Foreclosure sales: 609 (-23.2%)
Foreclosure Inventories: 4,552 (+4.0%)
Oregon foreclosure stats and trends
Foreclosure starts: 65 (+20.4%)
Foreclosure sales: 29 (+3.3%)
Foreclosure Inventories: 1,243 (-2.5%)
Washington foreclosure stats and trends
Foreclosure starts: 1,975 (-0.2%)
Foreclosure sales: 1,047 (+7.1%)
Foreclosure Inventories: 8,501 (+0.8%)


