Real Property Report - California, May 2015
California Median Home Prices and Sales Retreat in May
Median Home Prices Fall 1.8 Percent to $396,750,
Sales Down 3.5 Percent
CALIFORNIA, JUNE 23, 2015 -- California single-family home and condominium sales fell 3.5% to 36,912 in May from 38,249 in April. What is unusual this month is the decrease in sales was due to a decline in both distressed and non-distressed property sales that fell 8.6 percent and 2.5 percent, respectively. The monthly decline in non-distressed sales is the first May decline since 2005.
On a year-over-year basis, sales were up slightly, gaining 2.3 percent from 36,096 in May 2014. Regionally, year-over-year sales were down 3.5 percent across the nine Bay Area counties but up 5.6 percent in Southern California and 9.0 percent in Central California.
“While home sales were up statewide, results varied regionally,” said Madeline Schnapp, Director of Economic Research for PropertyRadar. “Year-over-year sales posted solid increases in Southern and Central California, likely due to lower price points and better affordability, but were lower in the Bay Area where many potential home buyers have been priced out of the market.”
The median price of a California home was nearly unchanged at $396,750 in May, down 1.8% from $404,000 in April. Within California’s 26 largest counties, most experienced slight increases in median home prices, edging higher in 21 of California’s largest 26 counties. The counties that saw the biggest median price increases were Santa Barbara (+11.4 percent) and Marin (+6.3 percent).
On a year-over-year basis, the median price of a California home was nearly unchanged, up 0.4 percent from $395,000 dollars in April 2014. While at the county level most of California’s 26 largest counties exhibited slower price increases, four counties continued to post double digit gains. Those counties were San Francisco (+20.0 percent), Stanislaus (+12.1 percent), Alameda (+10.3 percent) and Sonoma (+10.6 percent).
“With the exception of a few counties, price increases have slowed considerably,” said Schnapp. “You cannot defy gravity. The environment of rising prices on lower sales volumes was destined not to last. Higher borrowing costs since the beginning of the year and decreased affordability was bound to impact sales sooner or later. We may also be seeing the fourth year in a row where prices jumped early in the year, only to roll-over and head lower later the rest of the year.”
“One of the factors we keep hearing about that might impact sales is the ongoing drought,” said Schnapp. “New water regulations are coming down the pike fast and furiously. While we haven’t seen any broad based impact on residential real estate sales yet, grumbling about the new water restrictions is certainly becoming louder.”
In other California housing news:
- After two consecutive months of increases, Notices of Default fell 14.5 percent for the month to its lowest level since November 2014. Notices of Trustee Sale extended its prior month decline falling 19.2 percent to its lowest level since January 2015. Foreclosure sales erased its April gain, falling 14.8 percent back to March 2014 levels.
- Cash sales totaled 7,984 in May, down 5.0 percent from April and represented 21.6 percent of total sales. Cash sales as a percentage of total sales have been steadily declining since reaching a peak of 40.0 percent of total sales in August 2011. Since then, cash sales are down 43.7 percent. Cash sales as a percentage of total sales were highest in San Francisco (29.2%), Marin (25.6%), Sonoma (29.6%), and Santa Cruz (26.2%) counties.
- Flip sales totaled 1,207 in May, up 3.7 percent for the month and up 44.0 percent since January 2015. Flip sales are defined as properties that have been resold within six months. Flip sales comprised 3.3 percent of total sales in May, up 0.2 percent from 3.0 percent of sales in April. Flip sales peaked in July 2013 at 4.7 percent of total sales and have declined 37.9 percent since then.
- May Institutional Investor LLC and LP purchases totaled 1,293, down 3.5 percent for the month but were up 2.6 percent from April 2014. Over the longer term, institutional investor demand has retreated due to the lower return on investment and dwindling supply of distressed properties for sale. Institutional purchases were down 42.4 percent since peaking in December 2012. Similarly, Trustee Sale purchases by LLC and LPs were down 80.1 percent from their October 2012 peak.
Home Sales
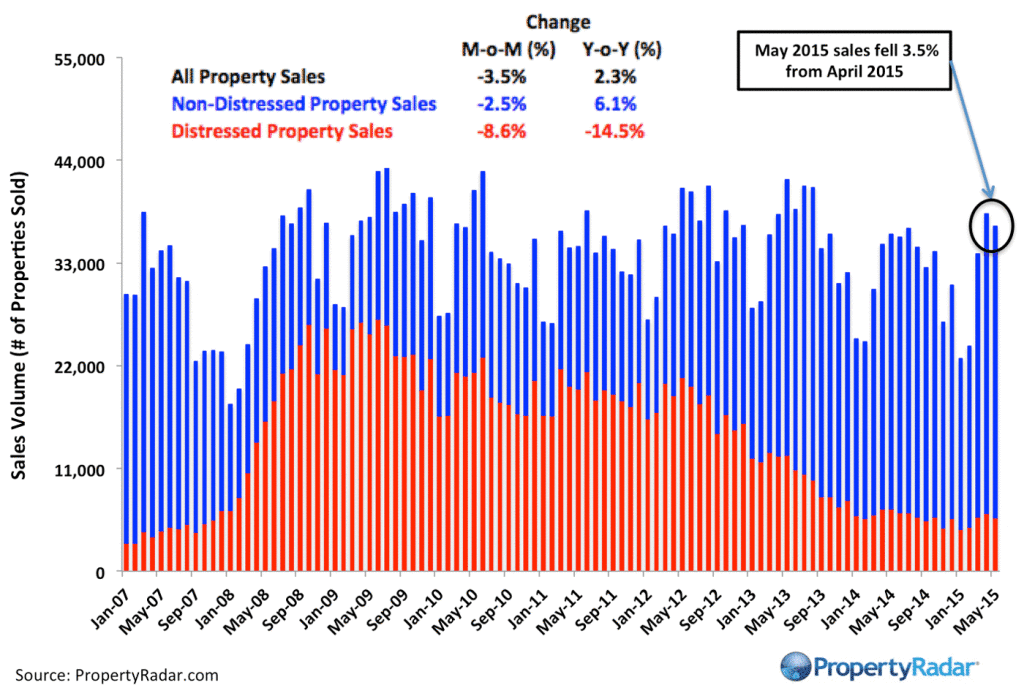
Home Sales - Single-family residence and condominium sales by month from 2007 to current divided into distressed and non-distressed sales. Distressed sales are the sum of short sales, where the home is sold for less than the amount owed, and REO sales, where banks resell homes that they took ownership of after foreclosure. All other sales are considered non-distressed.
Year-over-Year Home Sales
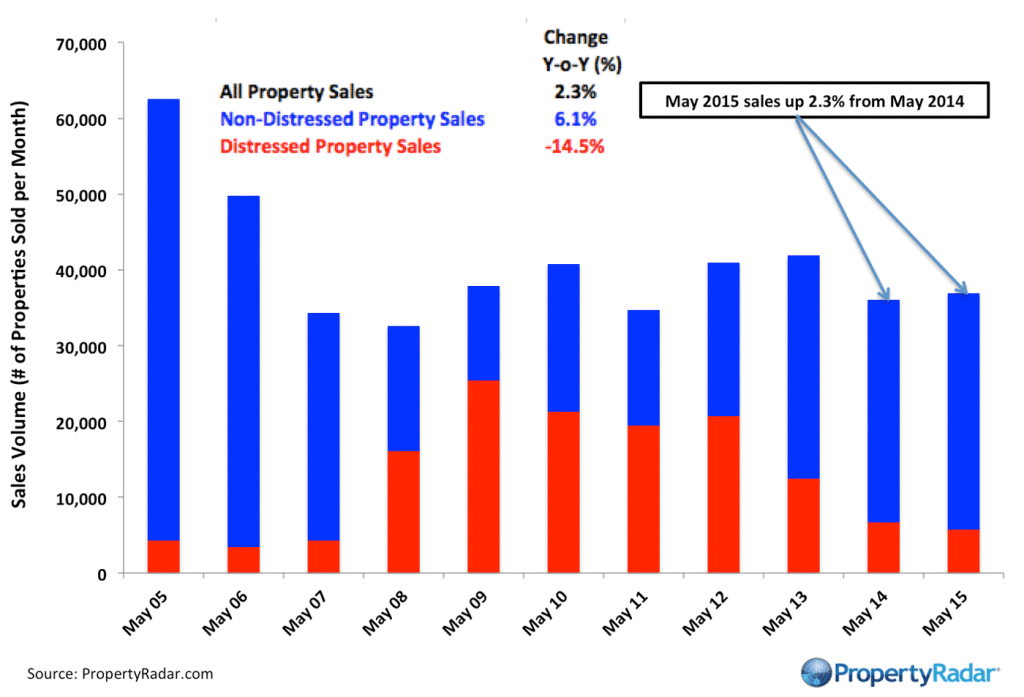
Year-over-Year Home Sales Year-over-Year Home Sales - Single-family residences and condominiums sold during the same month for the current year and prior years divided into distressed and non-distressed sales.
Median Sales Prices vs. Sales Volume
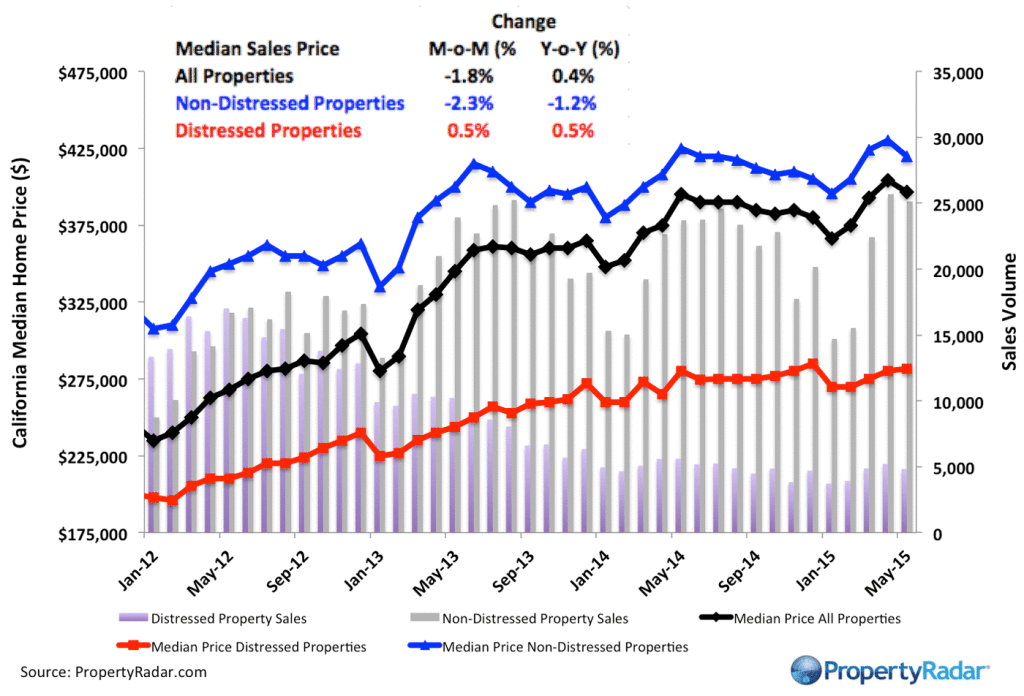
Median Sales Price vs. Sales Volume - Median sales price (left axis) of a California single family home versus sales volume (right axis), by month from 2012 to current. Median sales prices are divided into three categories: All single-family homes (black line), distressed properties (red line), and non-distressed properties (blue line). Monthly sales volumes (right axis) are illustrated as gray and lavender bars. The gray bars are distressed sales and the lavender bars are non-distressed sales.
California Homeowner Equity
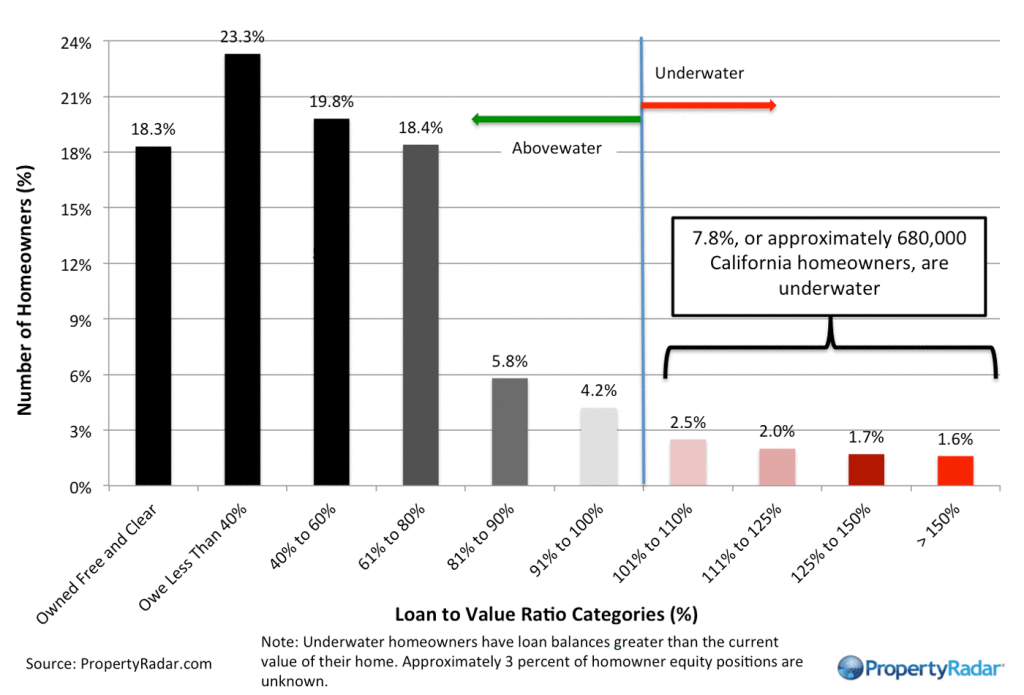
California Home Owner Equity - A model estimate of California homeowners segregated into various categories of levels of homeowner equity for a given month. Homeowner numbers represent a percentage of total California homeowners.
Cash Sales
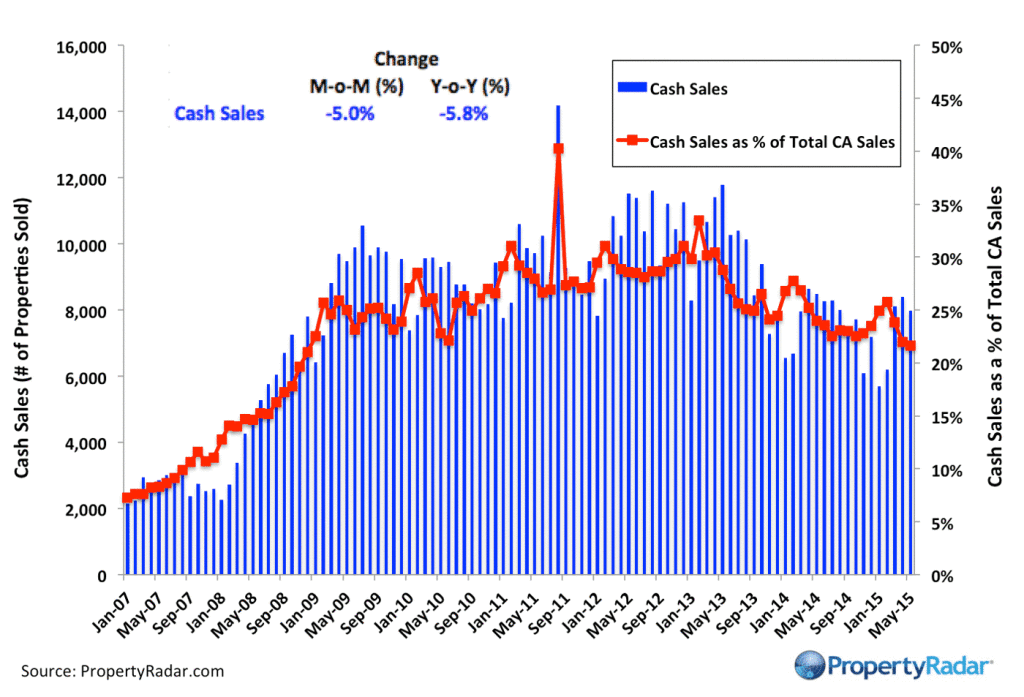
Cash Sales - The blue bars (right axis) illustrate cash sales of single-family residences and condominiums by month. The red line (left axis) illustrates cash sales as a percentage of total sales by month.
Flipping
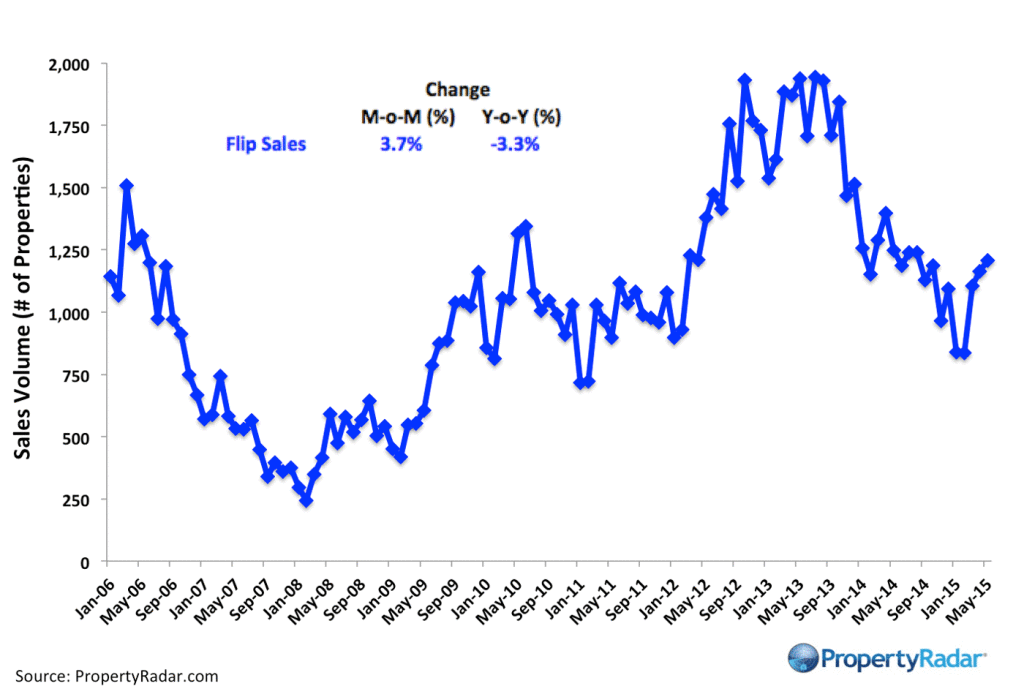
Flipping – The number of single-family residences and condominiums resold within six months.
Market Purchases by LLCs and LPs
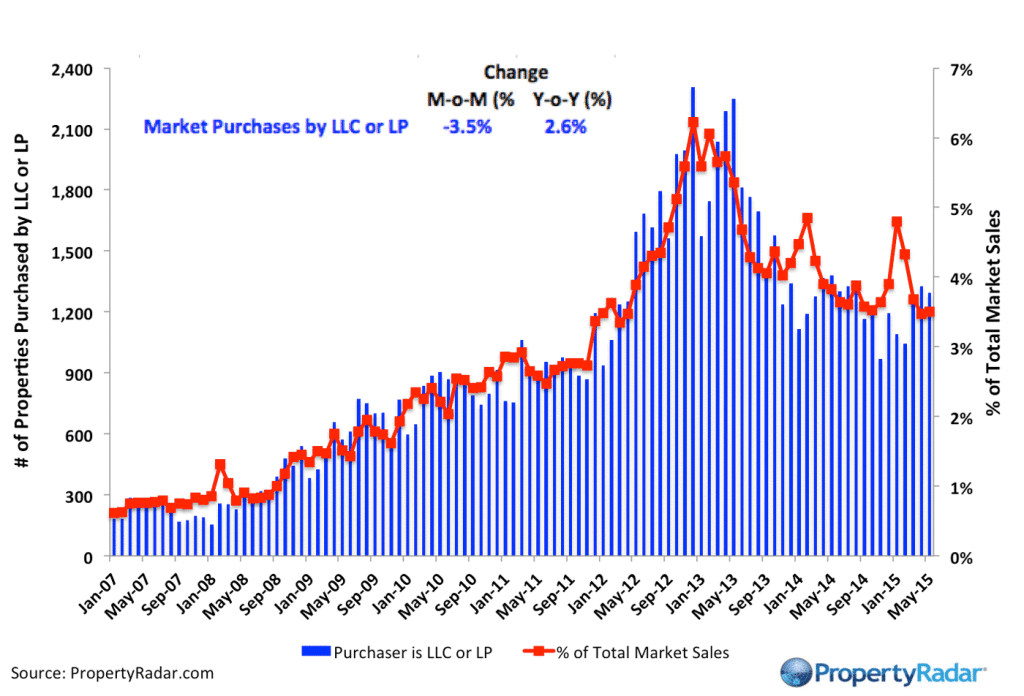
Market Purchases by LLCs and LPs - The blue bars (right axis) illustrate market purchases of single-family residences and condominiums by LLCs and LPs from 2007 to current. The red line graph (left axis) illustrates LLC and LP purchases as a percentage of total sales by month.
Market Sales by LLCs and LPs
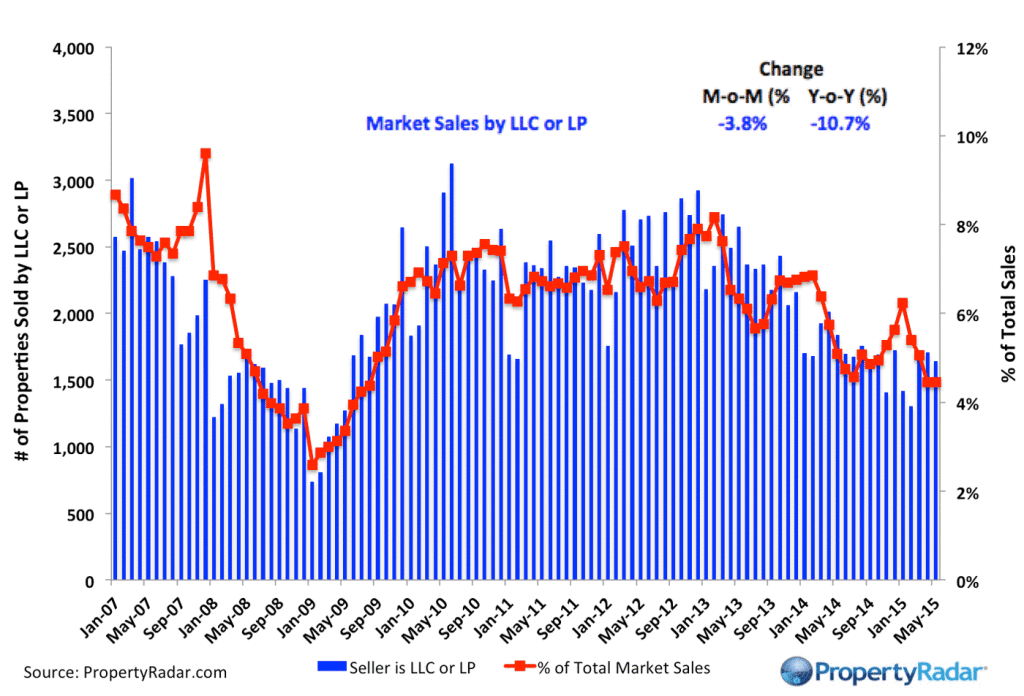
Market Sales by LLCs and LPs - The blue bars (right axis) illustrate market sales by LLCs and LPs of single-family residences and condominiums by month. The red line graph (left axis) illustrates sales as a percentage of total sales by month.
Trustee Sale Purchases by LLCs and LPs
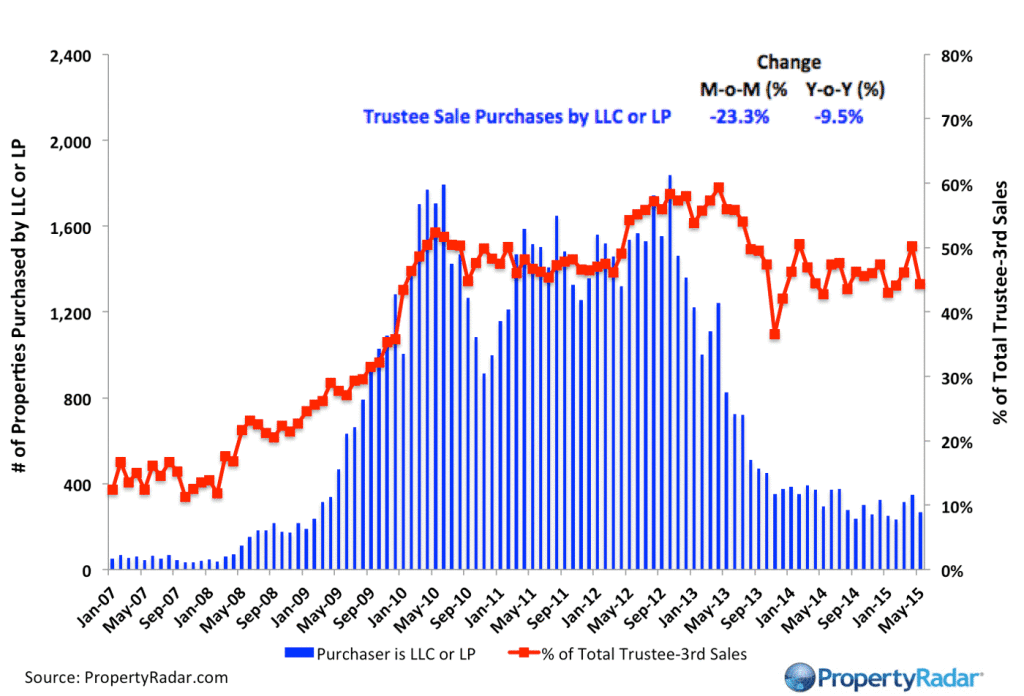
Trustee Sale Purchases by LLCs and LPs - The blue bars (right axis) illustrate trustee sale purchases (foreclosure sales) of single-family residences and condominiums by LLCs and LPs from 2007 to current. The red line graph (left axis) illustrates purchases as a percentage of total trustee sales by month.
Foreclosure Notices and Sales
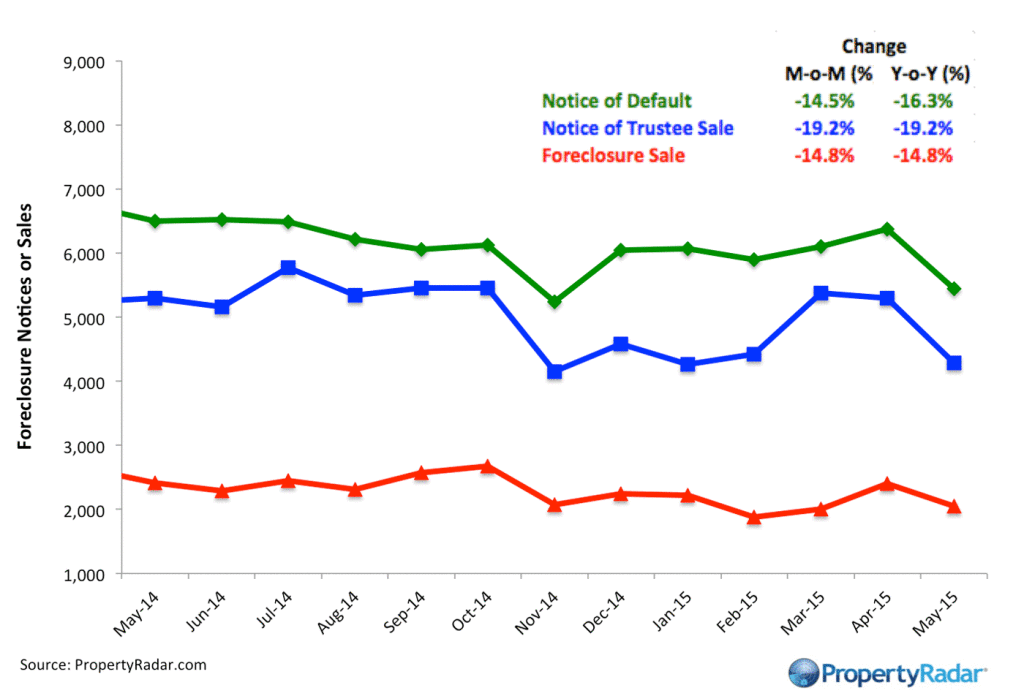
Foreclosure Notices and Sales - Properties that have received foreclosure notices — Notice of Default (green) or Notice of Trustee Sale (blue) — or have been sold at a foreclosure auction (red) by month.
Foreclosure Inventories
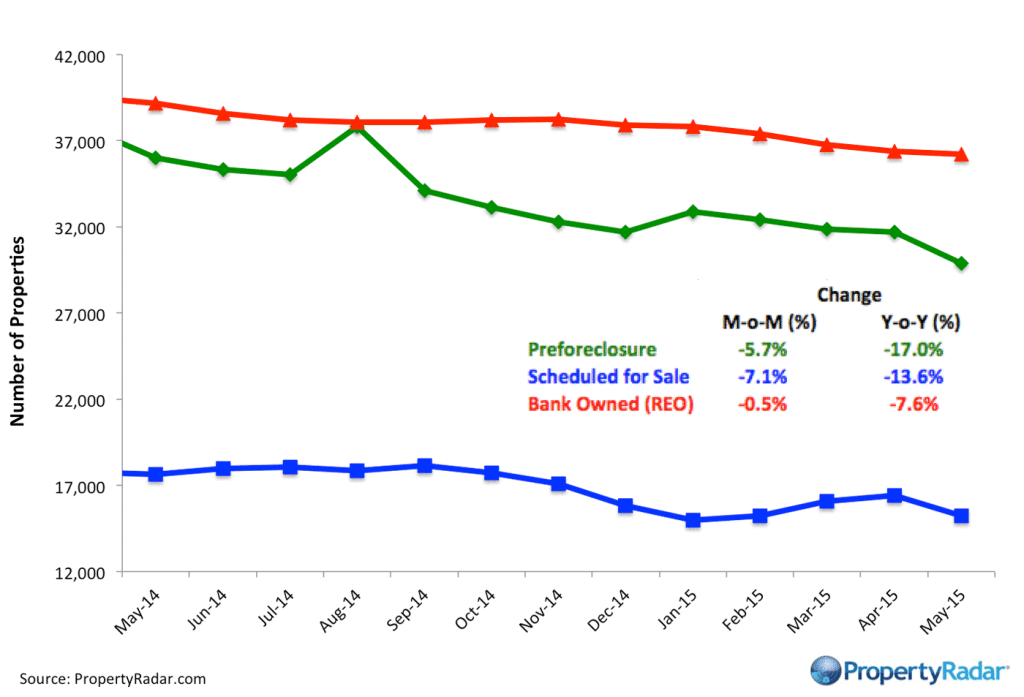
Foreclosure Inventory - Preforeclosure inventory estimates the number of properties that have had a Notice of Default filed against them but have not been Scheduled for Sale, by month. Scheduled for Sale inventory represents properties that have had a Notice of Trustee Sale filed but have not yet been sold or had the sale canceled, by month. Bank-Owned (REO) inventory means properties sold Back to the Bank at the trustee sale and the bank has not resold to another party, by month.
Real Property Report Methodology
California real estate data presented by PropertyRadar, including analysis, charts, and graphs, is based upon public county records and daily trustee sale (foreclosure auction) results. Items are reported as of the date the event occurred or was recorded with the California County. If a county has not reported complete data by the publication date, we may estimate the missing data, though only if the missing data is believed to be 10 percent or less.
