California Home Sales Jump 21 Percent in March while Median Home Prices Gain 4.6 Percent to Highest Level in Six Years
California single-family home and condominium sales were up 20.9 percent in March 2014 from February but were down 13.3 percent from March 2013. Both distressed and non-distressed property sales posted gains for the month. March 2014 distressed property sales gained 7.4 percent from February, while non-distressed property sales were up 25.2 percent.
“Despite the nice jump in March home sales, sales continue to be slower than we’ve seen since 2008,” said Madeline Schnapp, Director of Economic Research for PropertyRadar. “The supply of lower-priced distressed properties is disappearing at a rapid clip and is not being replaced by an adequate supply of non-distressed properties.”
The March 2014 median price of a California home hit its highest level since March 2008, rising $16,000, or 4.6 percent, to $366,000 from $350,000 in February. On a year-ago basis, median home prices jumped 13.3 percent. Driving the month-over-month price increase in March was a 25.2 percent increase in the sales volume of higher priced non-distressed properties.“
The jump in median home prices in March was somewhat of a surprise given the lackluster sales volume since last summer,” said Schnapp. “This past month, however, seasonal demand and lack of inventory drove up prices. In addition, higher priced non-distressed properties now comprise nearly 80% of total sales volume, up from 64% a year ago,” said Schnapp.
Rapid price increases will help create more for sale inventory by reducing the number of underwater California homeowners. The number of California homeowners with more than 10 percent equity in their homes increased 0.5 percent, or nearly 27,000, in March. Since August, an additional 393,000 homeowners, or an increase of 8 percent, now have more than 10 percent equity in their homes and can now participate in the real estate market and either sell or buy property.
“While the decline in negative equity will help with the lack of inventory problem,” said Schnapp. “It is important to keep in mind that nearly 1.2 million California homeowners, or 13.5 percent, remain underwater which continues to create significant headwinds for the California housing market.”
In other California housing news:
- Institutional Investor LLC and LP purchases gained 2.0 percent for the month but are down 26.5 percent from March 2013. Seventy-five percent of March LLC and LP purchases were for cash compared to nearly 80 percent in March 2013. Despite March’s modest gain, LLC and LP purchases are down 48.5 percent from their December 2012 peak.
- Cash sales were up 10.6 percent for the month but down 11.4 percent year-over-year.
- Flip sales gained 7.0 percent for the month but were down 26.9 percent year-over-year
- Foreclosure sales continued to decline, down 2.4 percent for the month and 40.1 percent year-over-year.
“In sum, while it is nice to see the increase in March sales activity, the combination of high prices and low inventory are clearly keeping us well below normal sales activity,” said Schnapp.
Home Sales
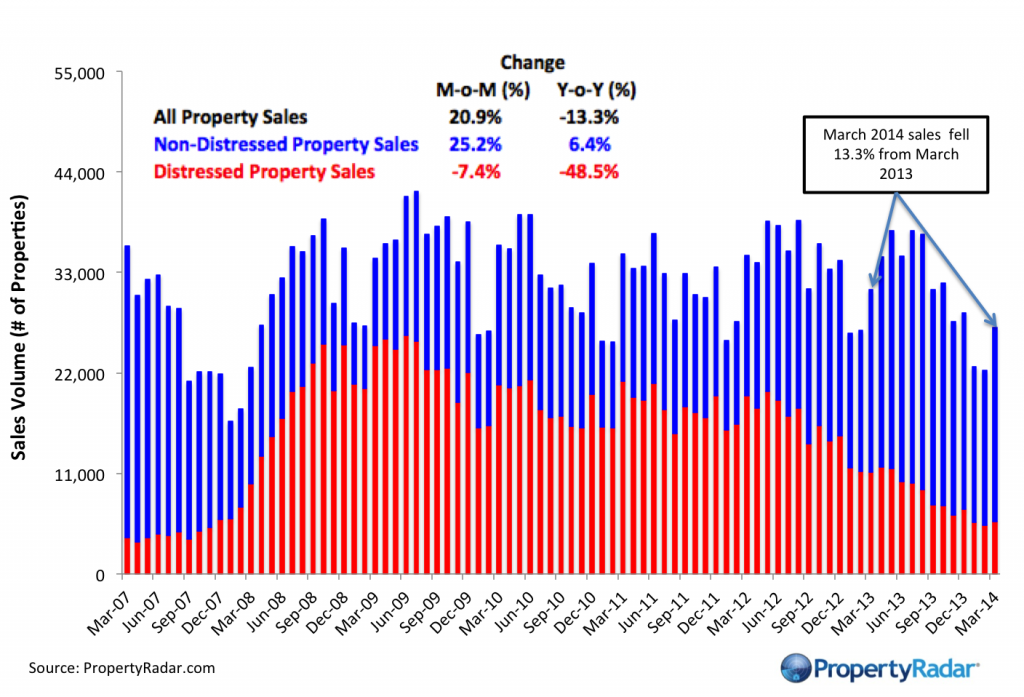
Home Sales - Single-family residence and condominium sales by month from 2007 to current divided into distressed and non-distressed sales. Distressed sales are the sum of short sales, where the home is sold for less than the amount owed, and REO sales, where banks resell homes that they took ownership of after foreclosure. All other sales are considered non-distressed.
Year-over-Year Home Sales
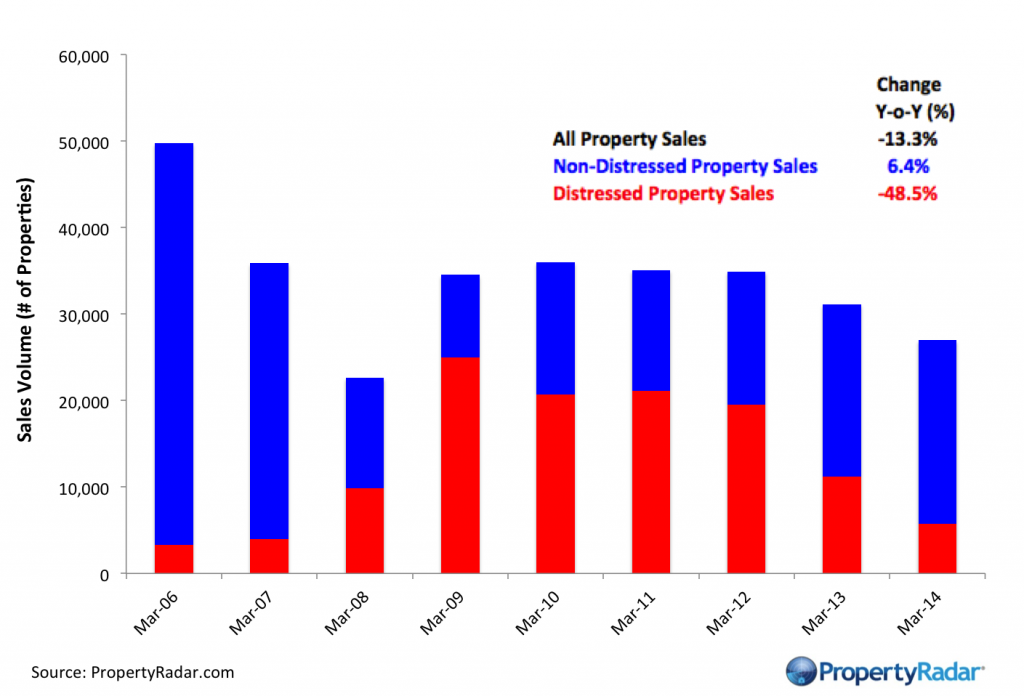
Year-over-Year Home Sales - Single-family residences and condominiums sold during the same month for the current year and prior years are divided into distressed and non-distressed sales.
Median Sales Prices vs. Sales Volume
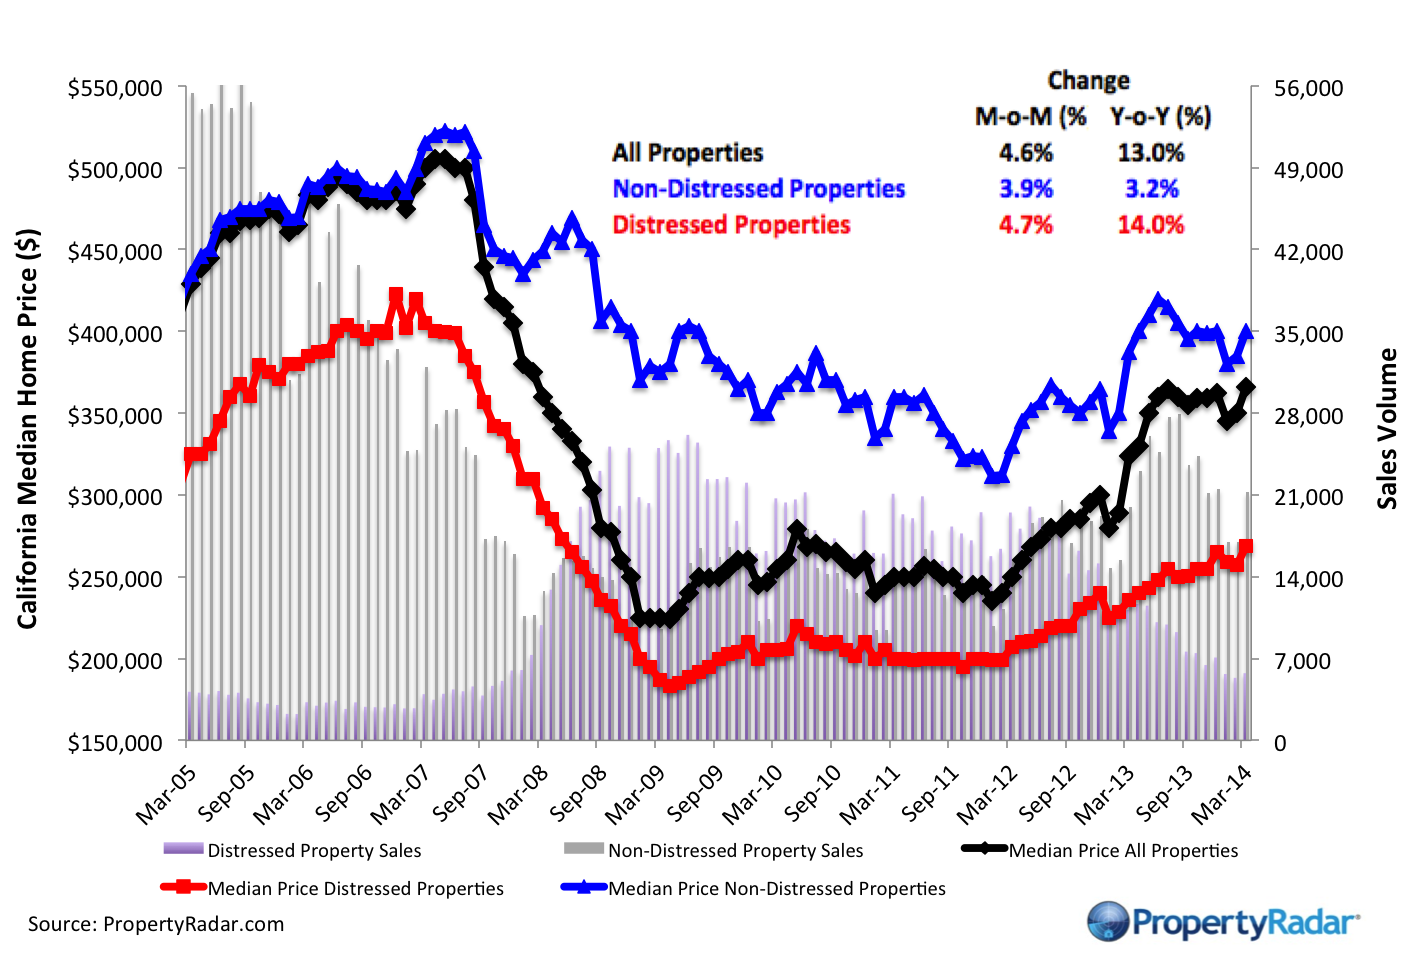
Median Sales Price vs. Sales Volume - Median sales price (left axis) of a California single family home versus sales volume (right axis), by month from 2005 to current. Median sales prices are divided into three categories: All single-family homes (blue line), distressed properties (red line), and non-distressed properties (green line). Monthly sales volume (right axis) are illustrated as gray and lavender bars. The gray bars are distressed sales and the lavender bars are non-distressed sales.
California Homeowner Equity
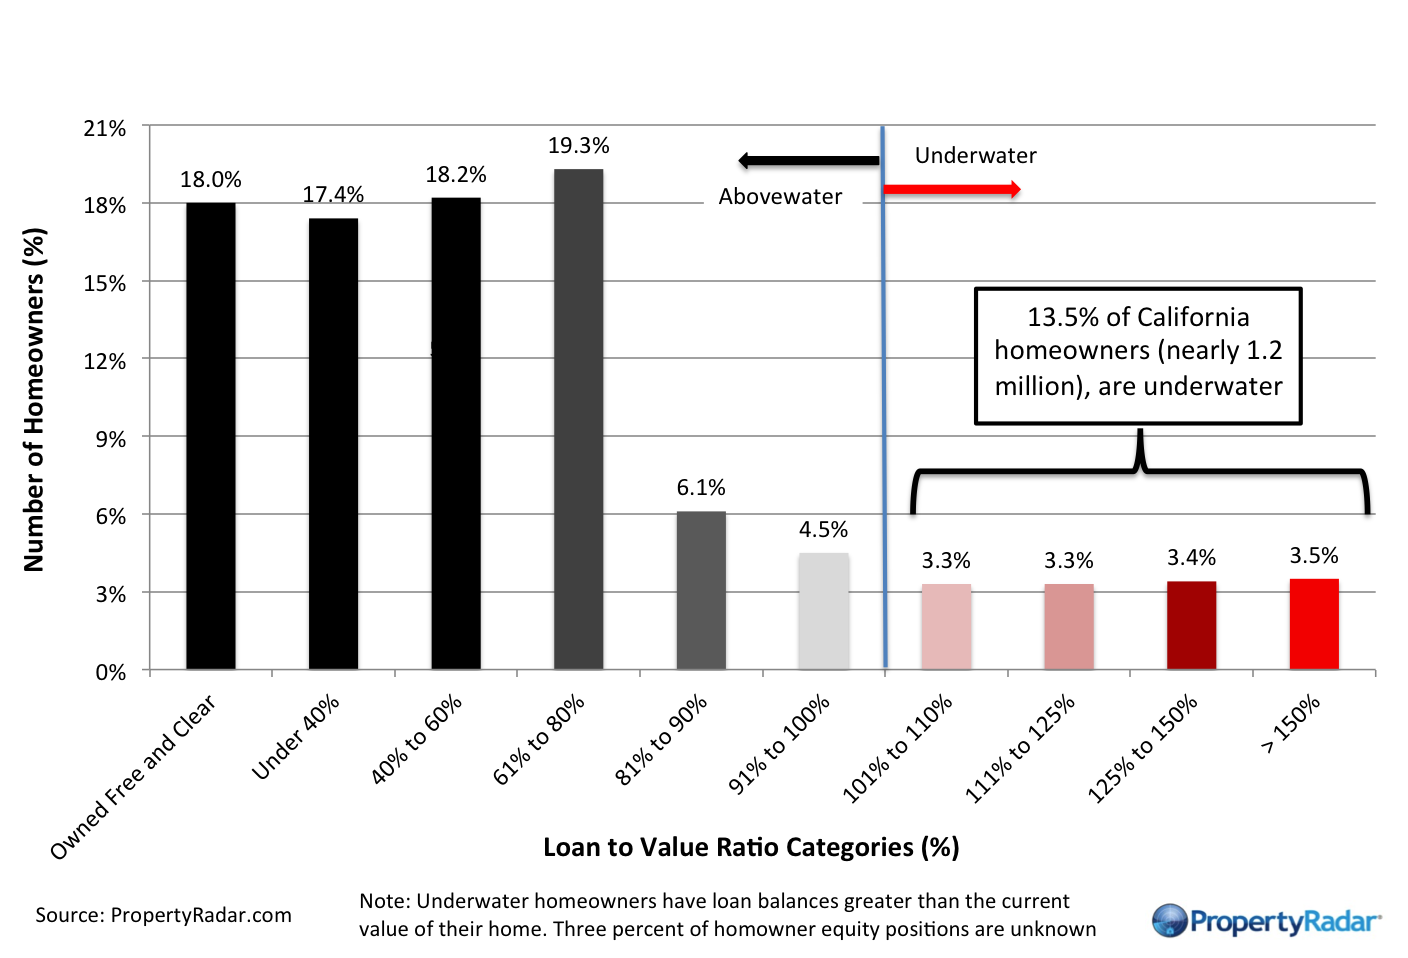
California Home Owner Equity - A model estimate of California homeowners segregated into various categories of levels of homeowner equity for a given month. Homeowner numbers represent a percentage of total California homeowners.
Cash Sales
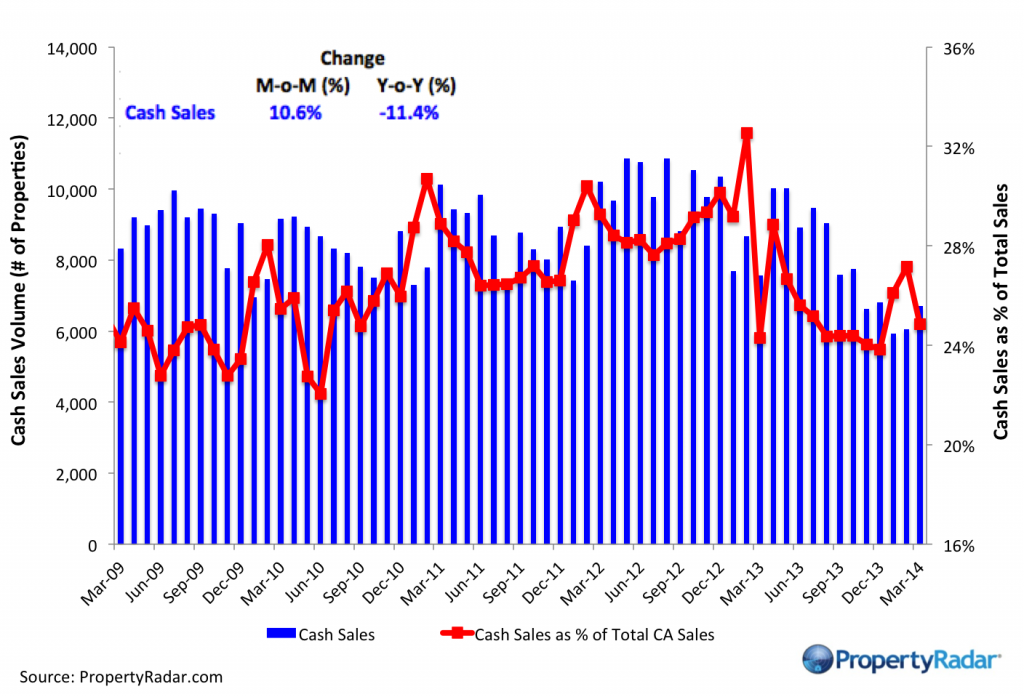
Cash Sales - The blue bars (right axis) illustrate cash sales of single-family residences and condominiums by month. The red line (left axis) illustrates cash sales as a percentage of total sales by month.
Flipping
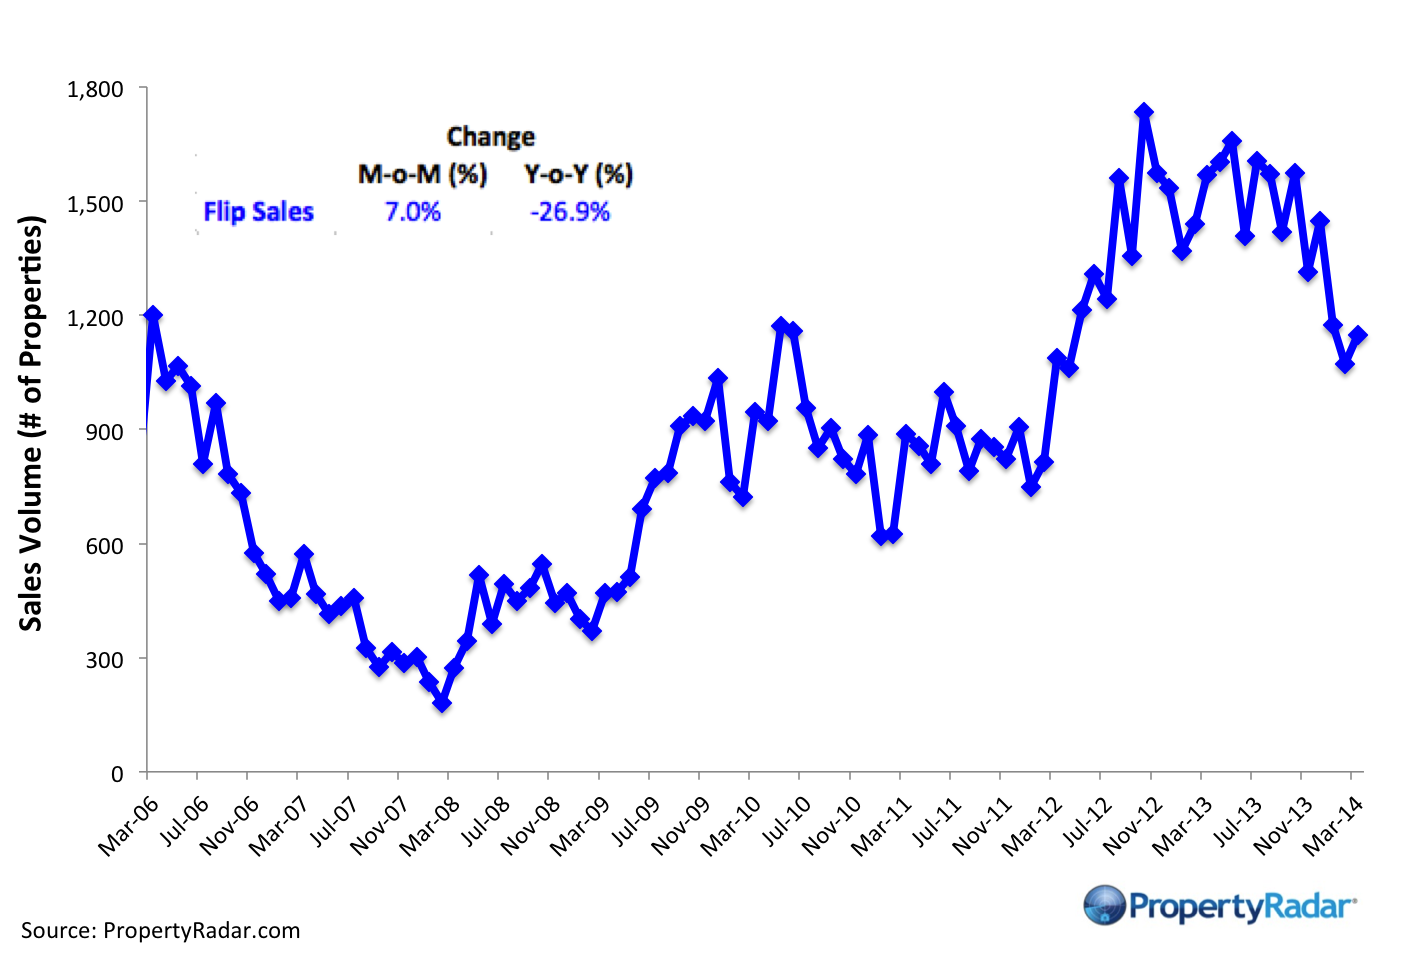
Flipping – The number of single-family residences and condominiums resold within six months.
Market Purchases by LLCs and LPs
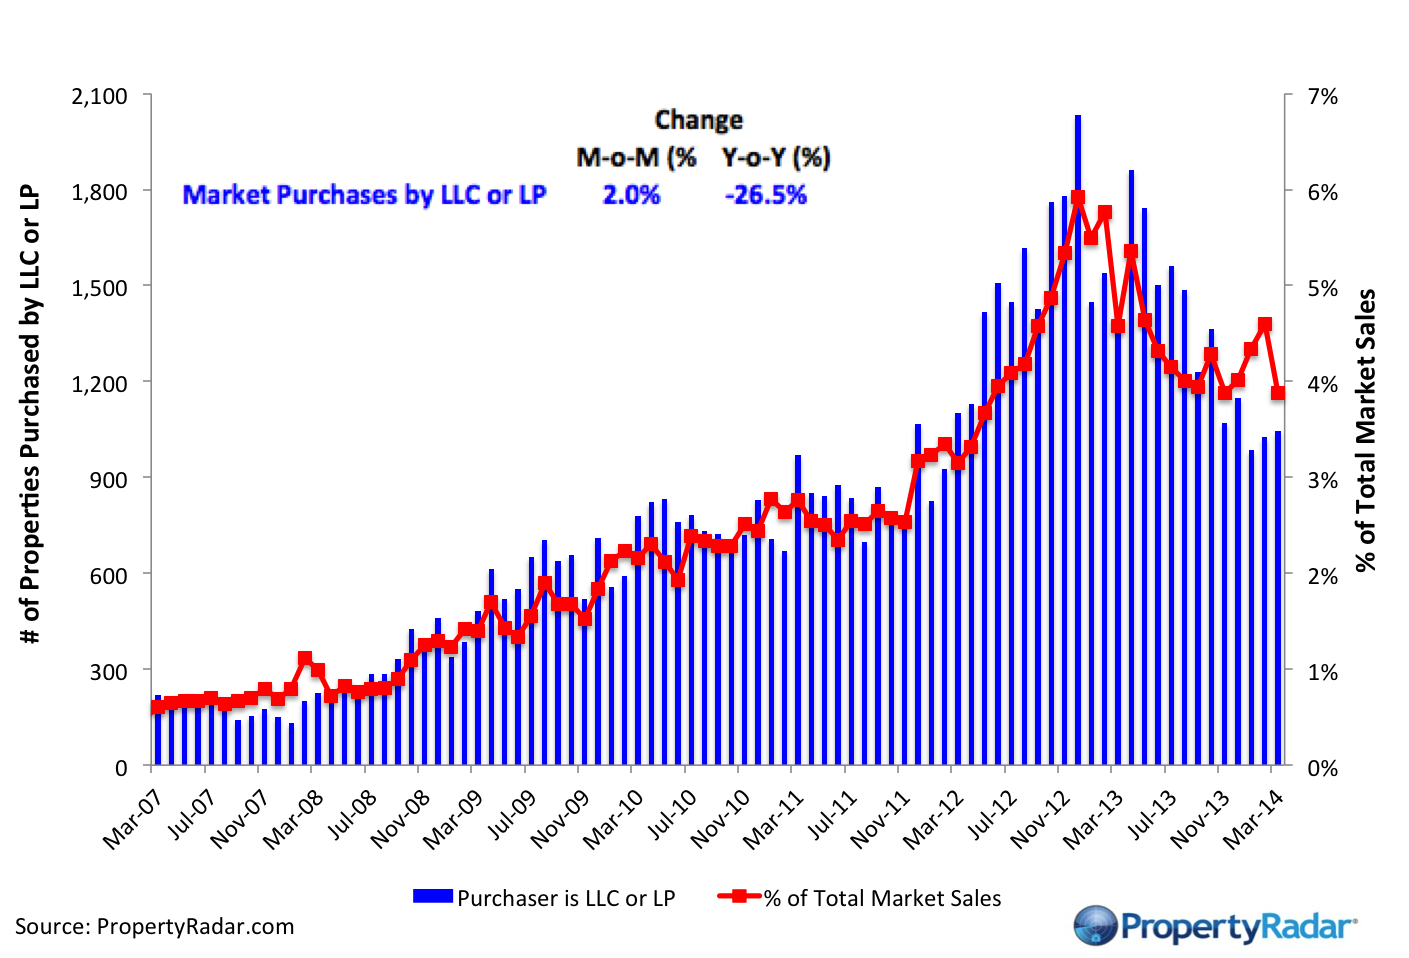
Market Purchases by LLCs and LPs - The blue bars (right axis) illustrate market purchases of single-family residences and condominiums by LLCs and LPs from 2007 to current. The red line graph (left axis) illustrates LLC and LP purchases as a percentage of total sales by month.
Market Sales by LLCs and LPs
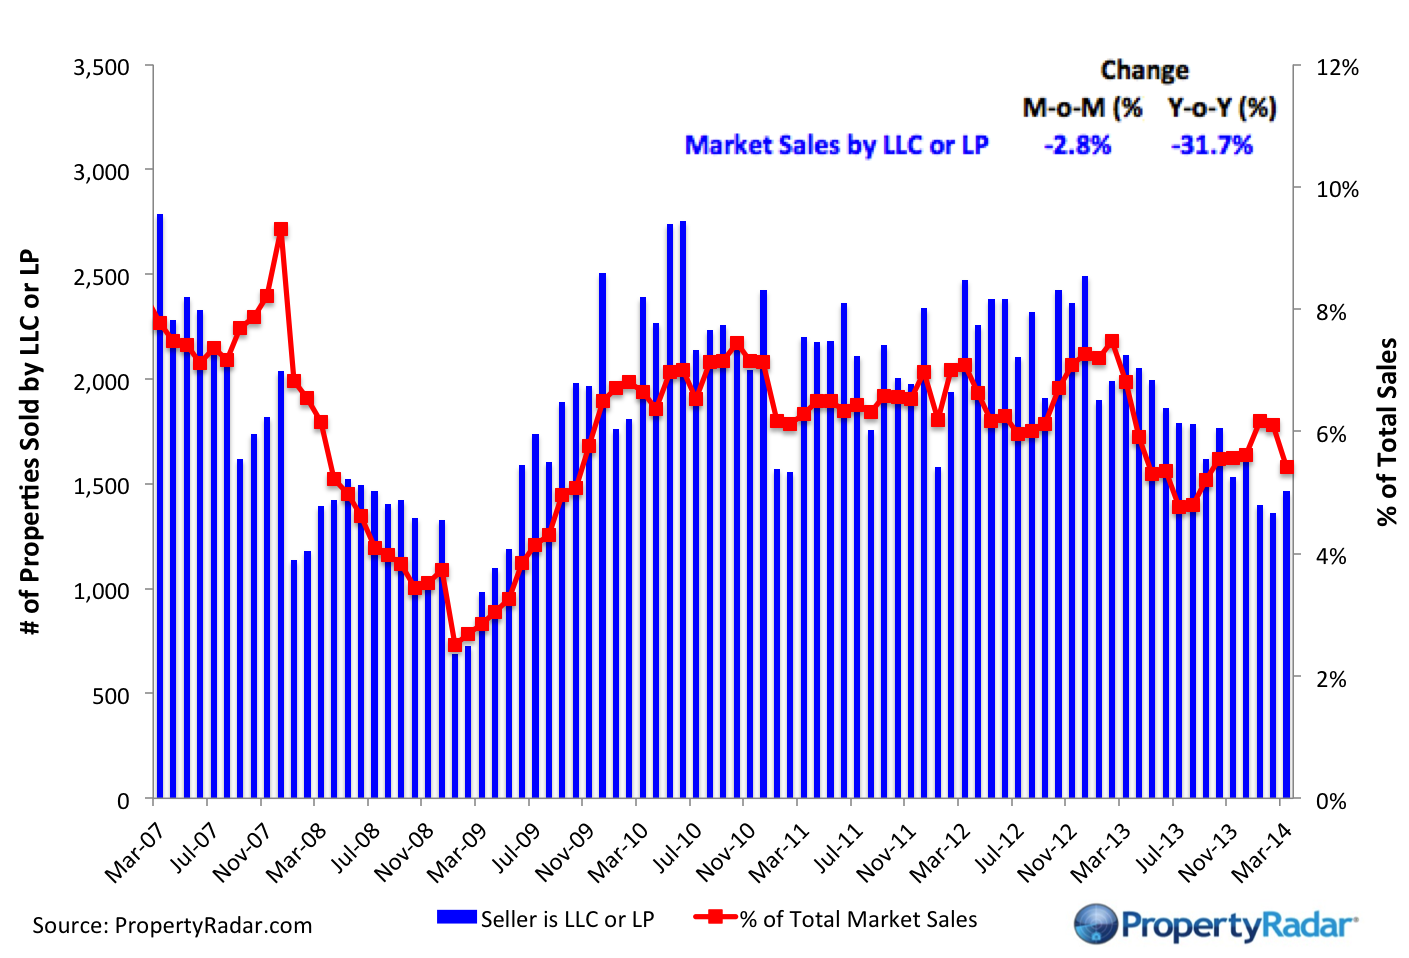
Market Sales by LLCs and LPs - The blue bars (right axis) illustrate market sales by LLCs and LPs of single-family residences and condominiums by month. The red line graph (left axis) illustrates sales as a percentage of total sales by month.
Trustee Sale Purchases by LLCs and LPs
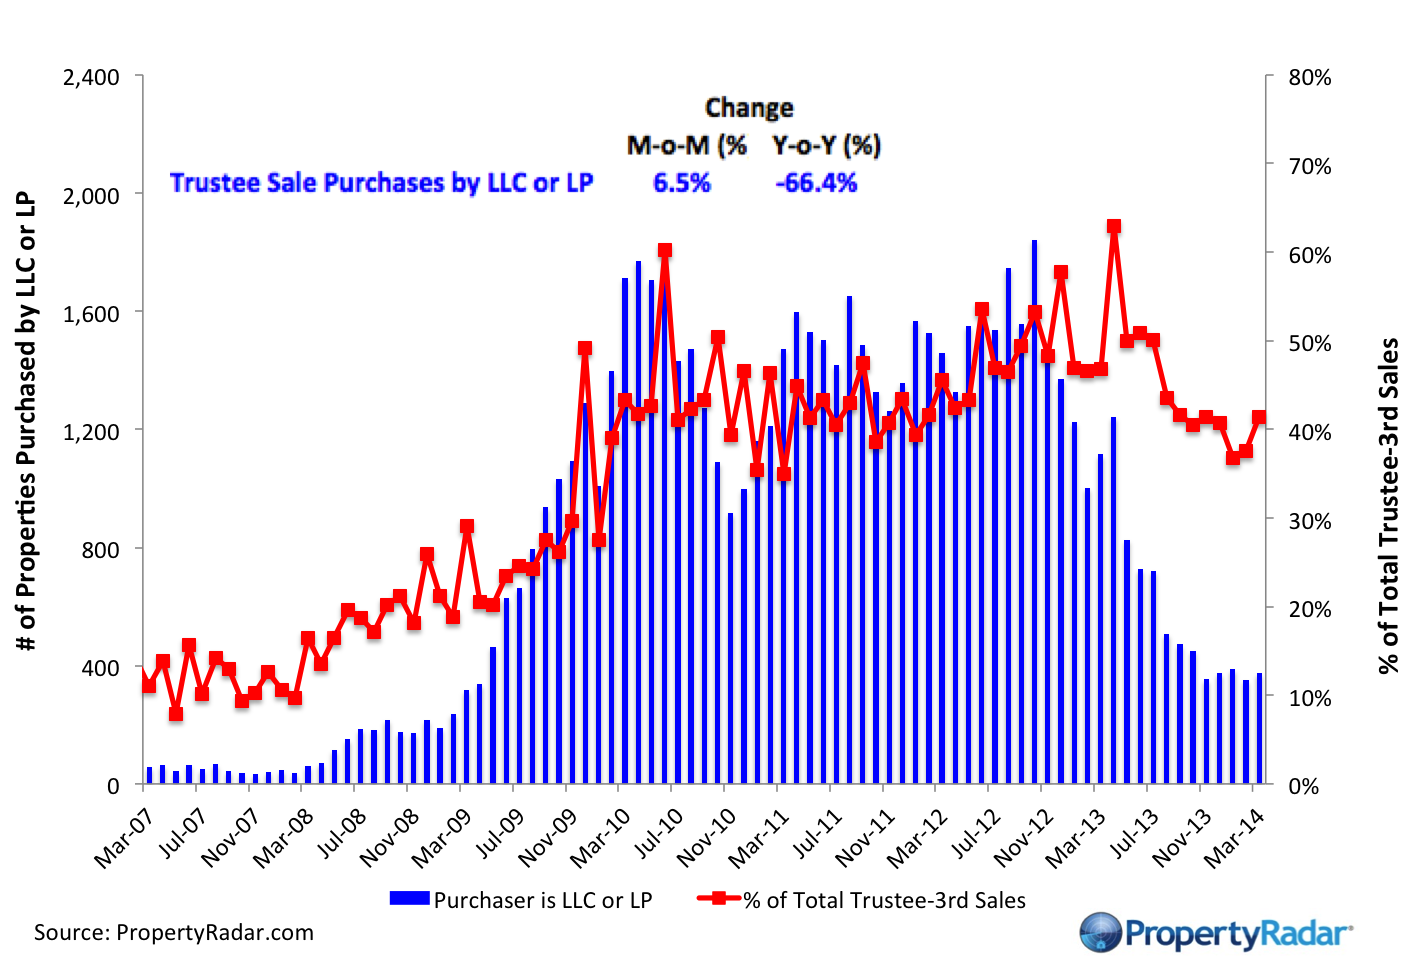
Trustee Sale Purchases by LLCs and LPs - The blue bars (right axis) illustrate trustee sale purchases (foreclosure sales) of single-family residences and condominiums by LLCs and LPs from 2007 to current. The red line graph (left axis) illustrates purchases as a percentage of total trustee sales by month.
Foreclosure Notices and Sales
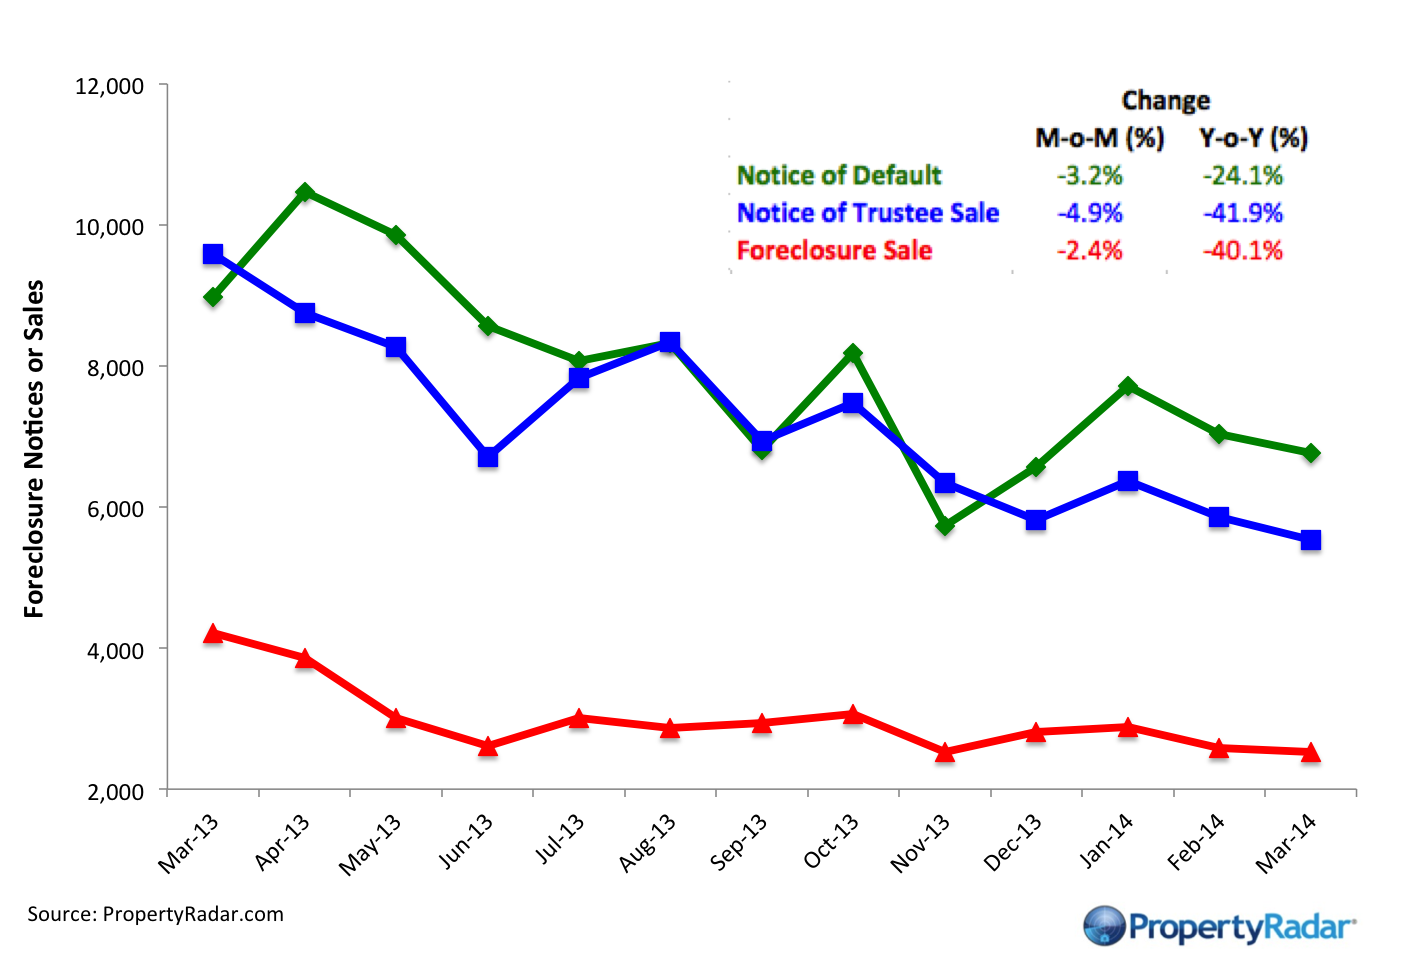
Foreclosure Notices and Sales - Properties that have received foreclosure notices — Notice of Default (green) or Notice of Trustee Sale (blue) — or have been sold at a foreclosure auction (red) by month.
Foreclosure Inventories
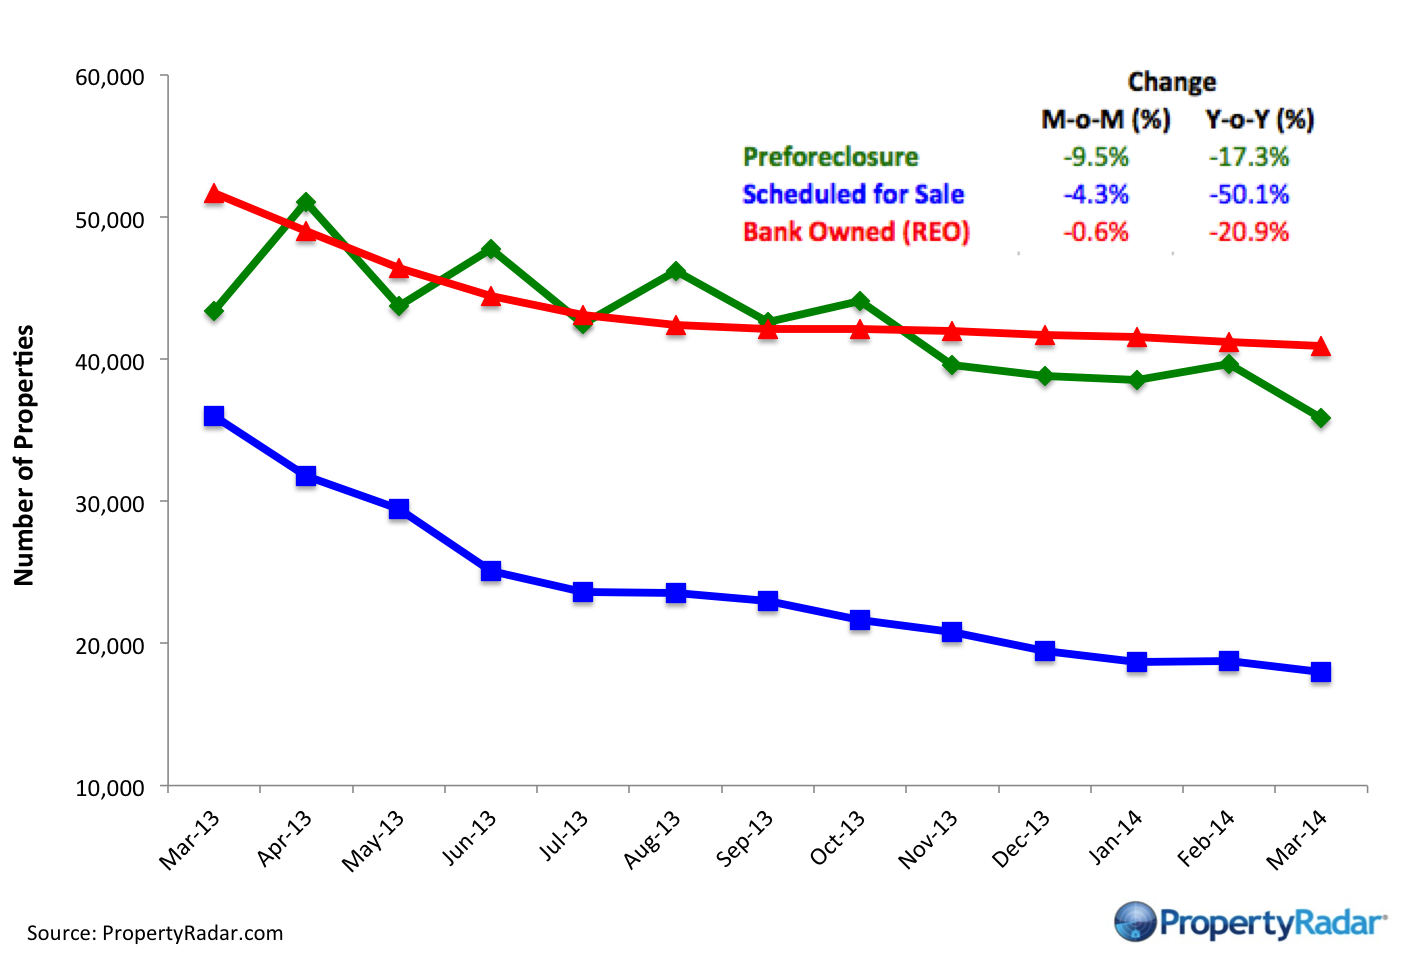
Foreclosure Inventory - Preforeclosure inventory estimates the number of properties that have had a Notice of Default filed against them but have not been Scheduled for Sale, by month. Scheduled for Sale inventory represents properties that have had a Notice of Trustee Sale filed but have not yet been sold or had the sale canceled, by month. Bank-Owned (REO) inventory means properties sold Back to the Bank at the trustee sale and the bank has not resold to another party, by month.
Real Property Report Methodology
California real estate data presented by PropertyRadar, including analysis, charts, and graphs, is based upon public county records and daily trustee sale (foreclosure auction) results. Items are reported as of the date the event occurred or was recorded with the California county. If a county has not reported complete data by the publication date, we may estimate the missing data, though only if the missing data is believed to be 10 percent or less of all reported data.
