Market Activity
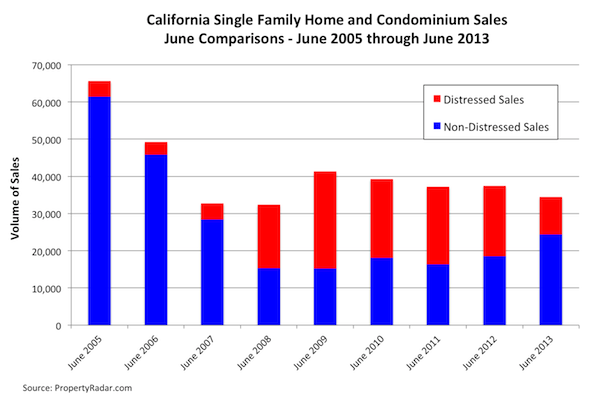
June 2013 California single-family home and condominium sales (aggregate sales) fell 2.3 percent from May, and 5.9 percent in the past 12 months (y-o-y). We define aggregate sales as the sum of distressed plus non-distressed property sales. Driving the decline in aggregate sales was the sharp change in the mix of distressed and non-distressed sales.
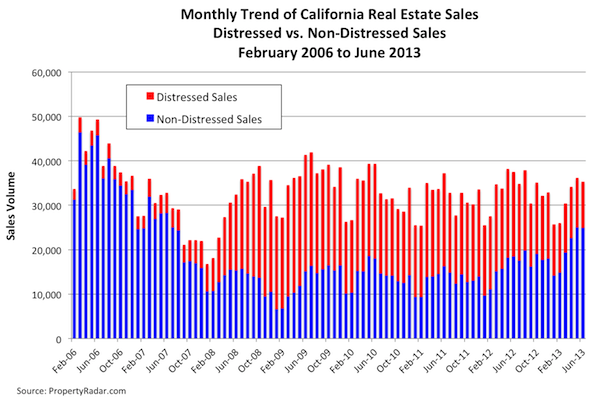
To get a clearer picture of current real estate sales trends and to eliminate seasonal factors, it’s helpful to compare last month’s distressed and non-distressed property sales to June sales in prior years. Distressed property sales fell 46.5 percent in the past 12 months, while non-distressed property sales jumped 31.3 percent. The larger decline in distressed property sales overshadowed the increase in non-distressed property sales.
The decline in distressed property sales is primarily due to government intervention that has slowed the flow of distressed properties to the marketplace. Despite this intervention, distressed sales comprise nearly 30 percent of total sales, more than three times historic averages, and remain an important part of the California real estate market.
In June 2013, distressed property sales were 29.3 percent of total sales, a 1.3 percentage point decline from 30.6 percent in May, down 21.2 percentage points from 50.5 percent in June 2012. Meanwhile, in June 2013, non-distressed sales accounted for 70.7 percent of total sales, a 1.3 percentage point gain from 69.4 percent in May. On a year-ago basis, June non-distressed property sales gained 21.2 percentage points from 49.5 in June 2012.
At the County Level, Non-Distressed Property Sales Post Strong Gains
At the county level, the percentage of non-distressed property sales relative to distressed sales varied dramatically. In general, the higher-income coastal areas of California experienced fewer distressed property sales in June, while the central parts of California continued to see higher levels of distressed property sales. Despite the decline in distressed property sales in the central parts of California, they remain historically high.
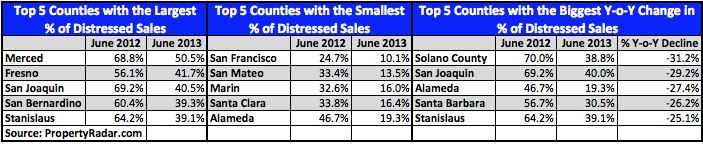
In June 2013, Merced County had the largest percentage of distressed property sales at 50.5 percent, down from 68.8 percent a year ago. Meanwhile, San Francisco County had the smallest percentage of distressed property sales at 10.1 percent, down from 24.7 percent a year ago.
While Solano County topped the list of counties with the largest percentage of distressed property sales in May, by June it was no longer in the top 5. Solano County topped the list of counties with the biggest drop in distressed property sales, falling 31.2 percentage points from 70.0 percent in June 2012 to 38.8 percent in June 2013. The other four counties with the largest decline in distressed property sales were San Joaquin, Alameda, Santa Barbara and Stanislaus Counties.
Table 1 lists the top 5 counties with the highest percentage of distressed-property sales, the lowest percentage of distressed property sales, and the biggest annual change in distressed property sales.
Table 1 – Top 5 California Counties with the Largest and Smallest and Biggest Y-o-Y Change in Percentage of Distressed Property Sales
Homeowner Equity
The biggest challenge confronting the California real estate market remains the huge numbers of California homeowners owing significantly more than their homes are worth. Underwater homeowners can neither sell their existing home, without impact their credit, nor in most cases buy another home, removing this important segment of the housing market from either contributing to housing inventory for sale or becoming potential buyers.
As of June, out of 6.9 million California homeowners with a mortgage, 2.0 million were underwater. Another approximately 500,000 homeowners had 10 percent or less equity in their properties. We define this group of homeowners as “near negative equity” and include them in the analysis because closing costs and repairs associated with the sale of a home typically amount to 6 to 10 percent of the sales price leaving these homeowners effectively underwater. The total of these two classes of underwater homeowners is 2.5 million. Of those 2.5 million underwater homeowners, more than 1.2 million owe more than 125 percent of their home’s value.
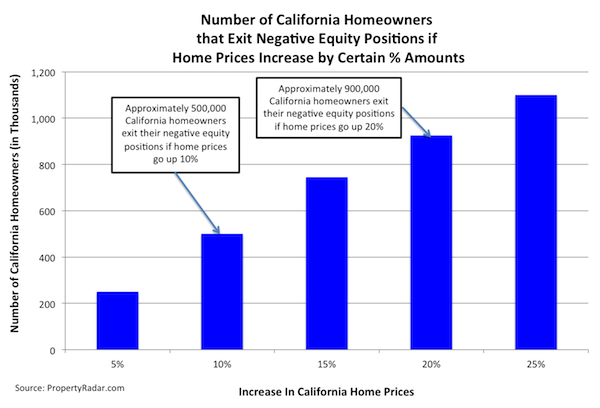
Rising home prices will continue to lift some underwater homeowners into a state of positive equity and into a position where they could choose to sell which could help alleviate some of the current inventory problems.
On average, in 2013 California home prices have been rising 1 to 2 percent per month translating into an annual gain of 12 to 24 percent. If home prices increase 10 percent, approximately 500,000 homeowners, or nearly 20 percent of negative equity homeowners, will be returned to a positive equity state. In addition, if home prices rise 20 percent, an estimated 900,000 homeowners, or approximately 36 percent of negative equity homeowners, will transition to a positive equity state. Even with a further 20 percent increase in home prices 1.6 million homeowners will remain underwater.
Median Prices
In last month’s California Property Report, we introduced the concept that a mix, in this case, distressed vs. non-distressed California single-family home sales, is skewing aggregate median sales price estimates and perhaps making them an unreliable measure of property value.
The median sales price of a California home jumped 33.9 percent from $310,000 in June 2012 to $415,000 in June 2013, improving on a 29.7 percent increase from May 2012 to May 2013. In the year ended June 2013, however, the mix of distressed versus non-distressed property sales changed dramatically. In June 2012, distressed property sales accounted for 52.2 percent of total sales.
By June 2013 distressed property sales had fallen to 29.3 percent of total sales. In the following graph, we highlight median sales price trends and sales volume from June 2001 to June 2013. Aggregate single-family home median sales prices are shown in blue, distressed median prices are in red and non-distressed median prices are in green. Distressed sales are shown as lavender bars, non-distressed sales are shown as gray bars.
Not surprisingly, when distressed property sales as a percent of total sales ranged from a low of 6.1 percent to a high of 17.2 percent from June 2001 through August 2007, aggregate median sales prices closely mirrored the median sales prices of non-distressed properties. As California real estate sales collapsed and the percentage of distressed property sales increased dramatically, the aggregate median sales price gravitated towards the median sales prices of distressed properties. Since June 2012, the rapid change in the mix of distressed and non-distressed property sales, particularly since January 2013, has pulled the median price of aggregate sales back towards the median sales prices of non-distressed properties.
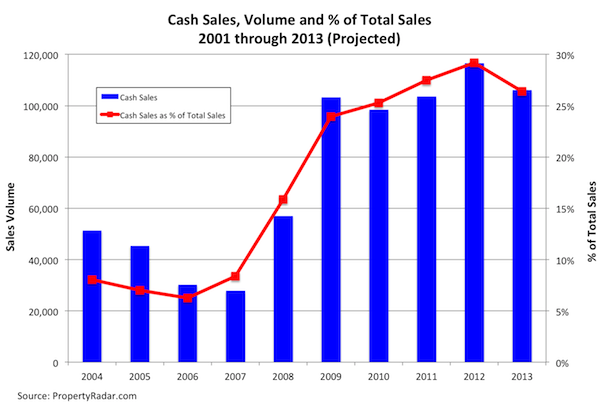
Cash Sales
In June 2013, cash sales were 26.4 percent of total sales, down 0.5 percentage points from 26.9 percent in May. Cash sales as a percent of total sales peaked at 33.8 percent in February 2013, have retreated 7.4 percentage points, but remain at an elevated level.
Despite the recent decline in cash sales and the change in mix, cash sales remain high relative to pre-2008 levels. The following graph illustrates historic trends punctuating the fact that cash sales remain an important part of the real estate marketplace.
Foreclosures
June 2013 Notices of Default (NODs) in California fell 15.1 for the month to 8,317. NODs have averaged nearly 8,900 per month since February after falling to a low of 4,856 in January. The sharp decline in January was due to seasonal factors and the implementation of the California Homeowner Bill of Rights, which went into effect on January 1.
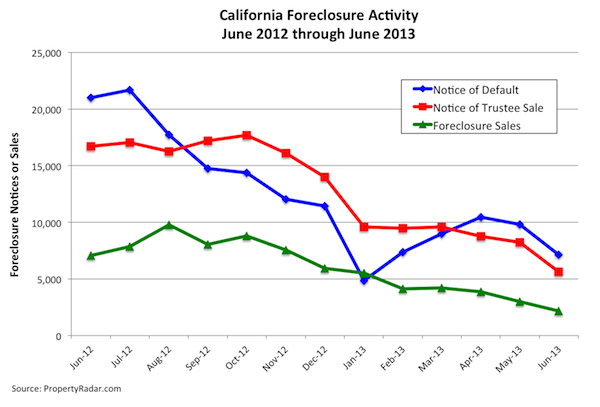
Notices of Trustee Sale were down 20.8 percent for the month and down 61.0 percent for the year.
California foreclosure sales totaled 2,159 in June, down 14.1 percent from May and down 63.6 percent in the past 12 months, their lowest level since January 2007.
The drop in May and June foreclosure sales was due, in part, to an Office of the Comptroller of the Currency (OCC) guidance letter that specified minimum standards for handling borrower files subject to foreclosure. As a result of the letter, several of the largest banks — Bank of America, Citi, JP Morgan, and Wells Fargo Bank — either slowed or stopped their foreclosure sales in May. By the end of May, Bank of America and JP Morgan had resumed their foreclosure sales activity, though it remained well below pre-May levels. As of June 16, it appears that both Citi and Wells Fargo Bank have resumed California foreclosure sales. With the return of the big banks to the foreclosure marketplace, foreclosure sales will likely increase in July.
Madeline’s Take - Director of Economic Research, PropertyRadar
Join me for a live Webinar about the California Property Report and I'll also share some great bonus material! July 19, 10am.
I am frequently asked the question, “Why is this recovery so slow?” The answer to that question is we are only part of the way through the massive deleveraging process that began with the bursting of the housing bubble. Until that process is complete, recovery will be slow.
The biggest challenge facing the California real estate market is not lack of inventory, but negative equity. An estimated 2.1 million California homeowners, or 24 percent of homeowners with a mortgage, owe more than their home is worth. Of those, an estimated 1.3 million homeowners, or 15 percent of homeowners with a mortgage, are significantly underwater. The good news is that as home prices rise, significant numbers of these homeowners exit their negative equity position and can become active participants in the real estate market.
In a classic case of well-intentioned but misguided policy, government intervention into the foreclosure market has slowed the foreclosure process to a crawl, condemning current homeowners to a prison of debt and depriving the California housing market of distressed property inventory depressing sales activity. At a time when housing demand has picked up and prices are rising, government policy needs to focus on resolving the negative equity issue rather than throwing up hurdles that only serve to lengthen the foreclosure process.
Sean’s Take - Founder/CEO, PropertyRadar
The recent rise in interest rates will likely impact the real estate market in the coming months. In the long run, higher interest rates will result in lower home prices, unless offset by wage increases. In the short run, it is unlikely we will see lower prices, which creates a window of opportunity for sellers and investors.
Homeowners, and even savvy investors, tend not to think of home prices in terms of how affordable the monthly payment is for the buyer. Prices are unlikely to fall to accommodate the new reality that buyers can afford less than they could just a few weeks ago. That fact, combined with low, but slowly rising, inventories will likely keep enough pressure on prices for them to at least remain flat, if not rise a little more.
While the outlook for prices remains relatively strong, I'm less hopeful about sales volumes. Given the lack of distressed inventory (unfortunately due to government intervention, not a lack of homeowners in distress), rising rates, and increasingly unaffordable prices, lower sales volume is likely. The one offsetting factor is that the rise in interest rates might motivate some who were sitting on the fence to act now. Those new buyers and sellers could cause a short-term increase in sales. Realtors and investors who can find or create inventory, especially at affordable price points, will do well.
