July 2017 Homes Sales Lowest Since 2010
Median Home Prices Fall in Four of Nine Counties
Solano and Sonoma County Home Prices Post Solid Y-o-Y Gains
CALIFORNIA, AUGUST 24, 2017 –San Francisco Bay Area home sales softened in July 2017 as a single-family home and condominium sales fell a higher than expected 19.5 percent from June 2017. July 2017 home sales were down 5.6 percent from 2016 marking the lowest July sales volume since 2010.
“San Francisco Bay Area home sales took a tumble in July, the lowest July sales since 2010 and the biggest June-to-July decline since 2006,” said Madeline Schnapp, Director of Economic Research for PropertyRadar. “While a sales decline in July is expected as we approach the end of the prime selling season, home affordability remains a persistent drag on the market with no end in sight.”
[tweet_box design="default" url="http://bit.ly/2vtzZgm" float="none" inject="via @propertyradar"]San Francisco Bay Area home sales tumble 19.5% in July, lowest since 2010.[/tweet_box]
At the county level, July 2017 sales were down from July 2016 in eight of the nine Bay Area counties. San Mateo, Solano, and Sonoma counties posted the largest annual declines of 16.2, 15.6, and 13.9 percent, respectively. Marin County was the only county that posted an annual sales gain of 6.1 percent.
San Francisco Bay Area Home Sales by County
Source: PropertyRadar, 2017
The July 2017 San Francisco Bay Area median home price (single-family residence) was $800,000, down 4.5 percent from $815,000 in June 2017. On a year-ago basis, prices were up 5.6 percent from $759,000 in July 2016. At the county level, July 2017 median home prices ranged from a low of $410,000 in Solano County to a high of $1.25 million in San Mateo County.
At the county level, median home prices were lower for the month in five of the nine Bay Area counties with three counties posting double-digit monthly declines; Alameda (-2.8 percent), Marin (-24.0 percent) and San Francisco (-17.9 percent), Santa Cruz (-13.3 percent) and Sonoma (-3.2 percent). Prices were unchanged in Contra Costa County.

“The large double-digit decline in Marin County seems to be an artifact of an unusually large number of short sales in the under $500,000 price range,” said Schnapp. “When those are removed from the database for the median home price rises significantly.”
“The median home price declines in the other counties suggest that we may be bumping up against a price ceiling,” said Schnapp. “The retreat from the median sales price peak of $1.4 million for a two-bedroom, one-bath San Mateo County home built in 1946 was likely a median price point peak for the season.”
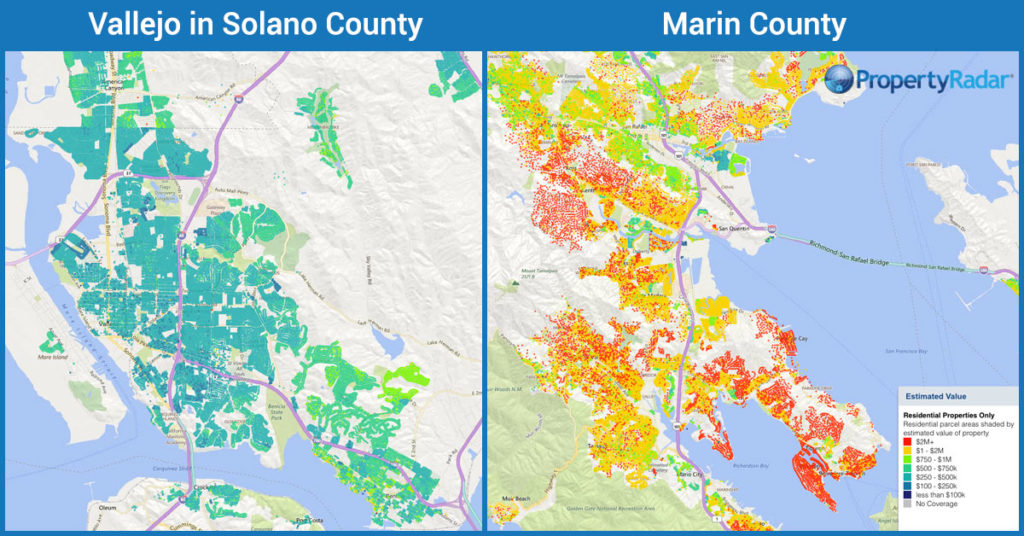
Compared to a year ago, July 2017 median home prices were down in four of the nine Bay Area counties. The largest price declines were in Marin (-13.7 percent), San Francisco (-9.8 percent), San Mateo (-3.8 percent), and Santa Cruz (-0.9 percent). The biggest annual price increases were in the lower-priced counties, Sonoma (9.1 percent), Solano (7.9 percent), Alameda (6.2 percent), Contra Costa (6.1 percent).
San Francisco Bay Area Median Home Prices by County (Single Family Residence)
Source: PropertyRadar, 2017
“Sonoma and Solano counties saw the highest annual median price increases,” said Schnapp. “These counties are the farthest from the San Francisco-Silicon Valley million-dollar corridor. Vallejo, a city in Solano County, saw their annual median home price jump nearly 20 percent.”
“Smart investors and homebuyers recognized that Vallejo, whose July median home price was $385,000, nearly 70 percent less than San Francisco’s, presented an interesting value proposition,” said Schnapp. “Vallejo’s secret weapon is the San Francisco Bay Ferry system that transports commuters from Vallejo to downtown San Francisco in an hour. Grab a cup of coffee, sit down next to a window and connect your laptop to the ferry’s WiFi system and watch some of the most spectacular scenery in the world roll by at 40 miles per hour. It’s no wonder that Vallejo real estate is popping.”
Vallejo’s Secret Weapon and the Key to Why Real Estate is in High Demand

Source: Flickr: Paul Kimo McGregor
Charting price increases from the recent trough in median prices provides an interesting view of where the biggest bang for the buck occurred. While sky-high San Francisco real estate prices grab headlines, price increases in Alameda and Contra Costa since 2009 yielded the highest returns. The median price increase from the price trough in San Francisco was 96 percent was dwarfed by the 171 percent increase in prices in both Alameda and Contra Costa counties.
“All else being equal if you bought a $600,000 home in San Francisco in 2009 your gross gain would be a tidy $600,000,” said Schnapp. “Across the Bay in Alameda, however, that same $600,000 could have gotten you two homes and your gain would be over $1 million. If you jump over to Vallejo in Solano County, you could have bought nearly five homes with a gain of nearly $1.25 million.”
San Francisco Bay Area Home Price Increases from Trough Month
Source: PropertyRadar, 2017
“Given the fact that economic growth fundamentals are unlikely to change anytime soon, for the savvy real estate investor or buyer that can tolerate a longer commute, there is still plenty of value out there in counties within striking distance of the San Francisco Bay Area,” said Schnapp. “Nosebleed prices in the Marin to San Francisco to Silicon Valley corridor are beginning to falter as buyers migrate to neighboring counties or out of the area in search of more affordable housing.”
San Francisco Bay Area Home Sales (9-County Region)
San Francisco Bay Area Home Sales – Total Single-family residence and condominium sales. Sales are illustrated by month from 2005 to current and are divided into distressed and non-distressed sales. Distressed sales are the sum of short sales, where the home is sold for less than the amount owed, and REO sales, where banks resell homes that they took ownership of after foreclosure. All other sales are considered non-distressed.
*Note: The San Francisco Bay Area is a nine-county region that includes the following counties: Alameda, Contra Costa, Marin, San Francisco, San Mateo, Santa Clara, Santa Cruz, Solano, and Sonoma. Previous San Francisco Bay Area home sales and median price reports did not include Solano, Sonoma and Santa Cruz counties.
San Francisco Bay Area Year-over-Year Home Sales
San Francisco Bay Area Year-over-Year Home Sales - Single-family residences and condominiums sold during the same month for the current year and prior years divided into distressed and non-distressed sales.
*Note: The San Francisco Bay Area is a nine-county region that includes the following counties: Alameda, Contra Costa, Marin, San Francisco, San Mateo, Santa Clara, Santa Cruz, Solano, and Sonoma.
San Francisco Year-to-Date Home Sales (January through July Totals)
San Francisco Bay Area Year-to-Date Home Sales – The sum of January through May sales of single-family residences and condominiums for the current year and prior years divided into distressed and non-distressed property sales.
*Note: The San Francisco Bay Area is a nine-county region that includes the following counties: Alameda, Contra Costa, Marin, San Francisco, San Mateo, Santa Clara, Santa Cruz, Solano, and Sonoma.
San Francisco Bay Area Median Home Prices (Year-over-Year February Comparisons)
Median Sales Price – Median sales price of a single-family home by county in the nine San Francisco Bay Area counties (Alameda, Contra Costa, Marin, San Francisco, San Mateo, Santa Clara, Santa Cruz, Solano, and Sonoma).

PropertyRadar Report Methodology
California real estate data presented by PropertyRadar, including analysis, charts, and graphs, is based upon public county records and daily trustee sale (foreclosure auction) results. Items are reported as of the date the event occurred or was recorded with the California County. If a county has not reported complete data by the publication date, we may estimate the missing data, though only if the missing data is believed to be 10 percent or less of all reported data.
About PropertyRadar
With a mission to make targeted local marketing easy, PropertyRadar is the leading property market intelligence and direct marketing platform for California Investors, Realtors®, and Real Estate Professionals who desire to leverage enhanced public records data to grow their business.
Over 10,000 Realtors®, Investors, and Real Estate Services Professionals have turned to PropertyRadar in CA, AZ, NV, OR & WA to discover market opportunities and connect with their prospects.
PropertyRadar (previously known as ForeclosureRadar) is a web-based subscription service providing the leads, data, analysis, marketing, alerts, and automation needed to find opportunities, reduce risk, and increase productivity.
