Market Activity
Join Madeline Schnapp for a LIVE WEBINAR on the California Property Report, June 21, 10amPST
In a month normally characterized by rising sales, May 2013 California real estate sales were nearly unchanged, falling 0.1 percent for the month and 11.1 percent over the past 12 months. A sharp change in mix of distressed versus non-distressed sales, beginning in January of 2013, appears to be driving the overall decline. While non-distressed sales increased dramatically as a percent of total sales over the past year, the gain has not been strong enough to offset the decline in distressed sales.
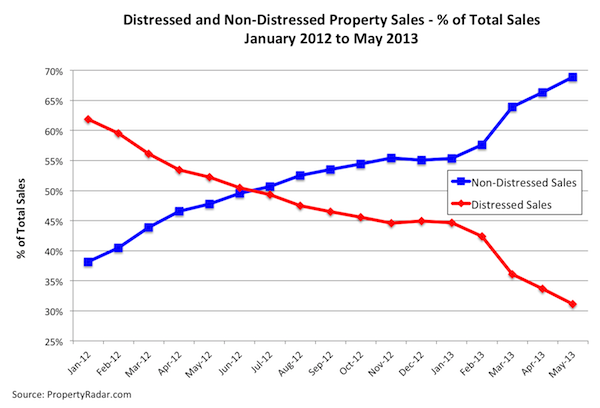
In May, distressed properties accounted for 31.1 percent of total sales, down 21.1 percent from 52.2 percent of sales a year ago. Meanwhile, non-distressed sales were 68.9 percent of total sales, up 21.1 percentage points from 47.8 percent a year ago.
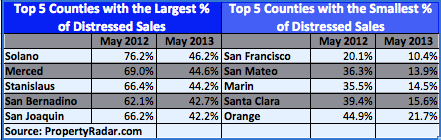
While statewide declines in distressed sales relative to non-distressed sales over the past year have been large, trends at the county level vary considerably. In May 2013, Solano County had the largest percentage of distressed-property sales at 46.2, down from 78.2 percent a year ago. Meanwhile, San Francisco County had the smallest percentage of distressed-property sales at 9.7 percent, down from 20.1 percent a year ago. Table 1 lists the top 5 counties with the highest percentage of distressed-property sales and the top 5 counties with the lowest percentage of distressed-property sales.
Table 1 – Top 5 California Counties with the Largest and Smallest
Percentage of Distressed Property Sales
Median Prices
Median sale prices appear to have been significantly impacted by the change in the mix between distressed and non-distressed property sales. We have found in previous research that banks foreclose more quickly on lower-end properties, and therefore lower-end properties make up a greater share of distressed properties.
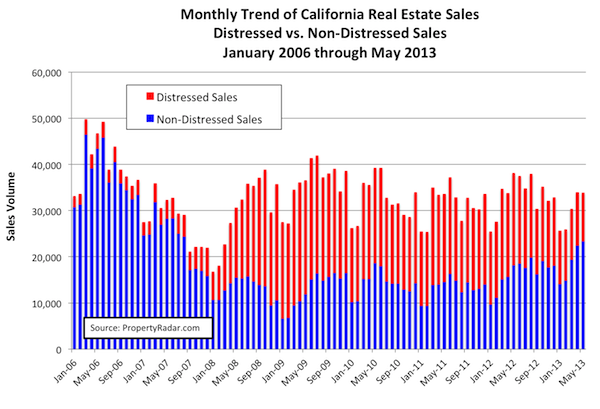
Prior to 2007, distressed property sales represented less than ten percent of the market and exerted little impact on median prices. Beginning in January 2007, however, distressed property sales began to rise.
By August 2008 distressed property sales exceeded 50 percent of total California property sales, exerting considerable downward pressure on median prices. It is important to understand that during these periods median price reflects both real changes in price and a shift in the mix of properties being sold – from higher-end homes to lower-end homes.
Beginning in September 2012, distressed property sales fell below 50 percent of total sales. By May 2013 distressed property was only 31.1 percent of total sales reflecting another shift of properties being sold – this time from lower-end homes to higher-end homes.
The behavior of median prices in California over the past year provides a perfect example of how a shift in mix impacts median prices. In May of 2012, California distressed property sales were 56.2 percent of total sales and the median price was $300,000. By May 2013, distressed property sales had fallen to 31.1 percent of total sales and the median price jumped 29.7 percent to $389,000.
The dramatic increase in California median prices over the past year begs the question of whether or not the price increase is real or an artifact of the change in the mix of properties being sold. In order to shed light on this question, we divided all properties into two sub-categories – distressed and non-distressed properties – and computed median prices for each of the two sub-categories. The results are summarized in Table 2.
Table 2 – California Median Price Summary
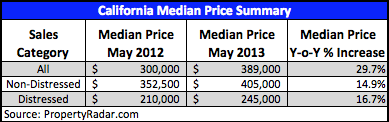
The results show that the year-over-year increase in median prices for all properties is nearly double the year-over-year median price increase of either distressed or non-distressed properties alone.
The impact of mix on median home prices is even more pronounced at the county level. Median price increases for all, distressed and non-distressed property sales are tabulated for ten of the largest California counties in Table 3.
Table 3 – Select County Median Price Summary
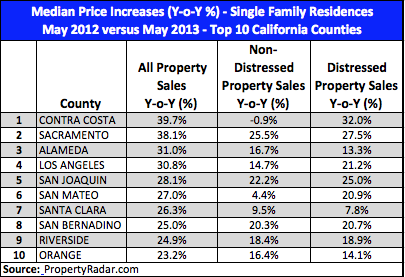
Property sales in Contra Costa County provide an excellent example of the distortion mix has on median prices. The median price increase between May 2012 and May 2013 computed using all Contra Costa property sales was 39.7 percent. When property sales are divided into distressed and non-distressed property sales and median prices are compared, an entirely different picture emerges. In May of 2012, Contra Costa County distressed property sales amounted to 53.2 percent of total county sales. By May of 2013, distressed property sales had fallen to 30.4 percent. Over that time period, the median price of distressed property sales rose 32.0 percent year-over-year from $235,000 to $310,000. Meanwhile, the median price of non-distressed sales fell 0.9 percent year-over-year from $530,000 to $525,000. This does not necessarily indicate that non-distressed prices fell in Contra Costa, as even within the non-distressed category mix likely changed, with more non-distressed sales under $500,000.
The divergent median price increases computed from the different property categories suggest that median prices are significantly impacted by mix and maybe impart a distorted view of actual price movements.
Cash Sales
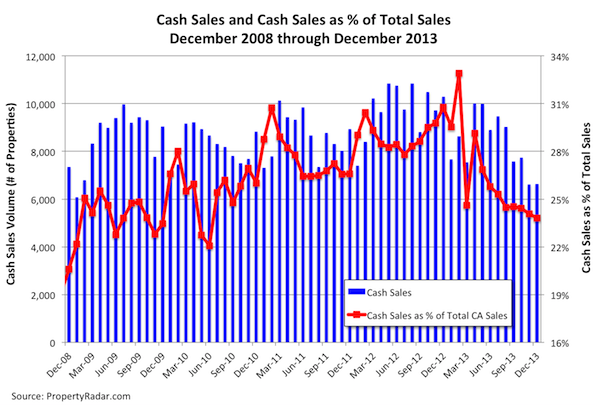
In May 2013, cash sales were 27.1 percent of total sales, down 2.2 percent from April’s total of 29.3 percent. Cash sales as a percent of total sales peaked at 33.8 percent in February 2013. While cash-sale volumes have been relatively unchanged in recent months, the recent decline in cash sales as a percent of total sales reflects the rapid rise in non-distressed sales and the fall in distressed sales.
Despite the recent drop-off in cash sales, total cash sales have increased dramatically as a percent of total sales from 2008 to today. From 2001 through 2007, cash sales ranged from a low of 27,381 to a high of 51,387 and represented only 6.2 percent to 8.4 percent of total market sales. In 2008, as the housing market collapsed and prices plummeted, real estate investing became more attractive and cash buyers jumped into the market. By the end of 2008, cash sales had risen to 57,019, or 15.9 percent of total sales. By 2012, cash sales had swelled to 116,549, or 29.2 percent of total sales. Cash sales as a percent of total sales now appear to be heading lower.
Foreclosures
California Notices of Default (NODs) fell 10.2 percent in May, their first decline since January. Trends in NODs have been oscillating around the 10,000 notice level after a temporary decline due to the implementation of the California Homeowner Bill of Rights, which went into effect on January 1.
Foreclosure Notices — Notices of Default plus Notices of Trustee Sale — were down 9.1 percent for the month and down 53.7 percent for the year.
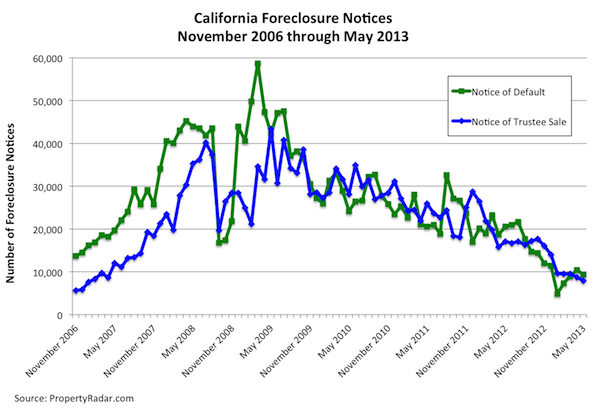
California foreclosure sales fell 23.1 percent in May and are down 63.6 percent for the year, reaching their lowest level since January 2007. The dramatic drop in May foreclosure sales resulted from an Office of the Comptroller of the Currency (OCC) guidance letter that specified minimum standards for handling borrower files subject to foreclosure. Several of the largest banks either slowed or stopped their foreclosure sales in May while they digested the requirements of the new guidelines. At the end of May, JPMorgan appeared to have resumed foreclosure sales. Meanwhile, foreclosure sales from Citi and Wells Fargo Bank were down 50 percent and 75 percent since the letter, respectively, from their March and April levels. We expect foreclosure sales to pick up in June as banks incorporate the new standards.
For a more complete discussion of May foreclosures, please see the PropertyRadar blog post, California Notices of Default Fall 10.2 Percent in May.
Madeline’s Take - Director of Economic Research, PropertyRadar
The dramatic 29.7 percent year-over-year increase in California median home prices belies the fact that May sales, a month normally characterized by rising sales, declined 11.1 percent year-over-year. Taking a longer-term view, year-to-date market sales were down 6.4 percent from 2012 and have actually been nearly unchanged and relatively flat since 2009. In this bifurcated market, non-distressed sales are up smartly for the year but distressed sales are falling faster than the rise in non-distressed sales.
Driving the divergence in trends is the weird alchemy of artificially low interest rates driving up demand, thwarted by millions of underwater homeowners and government policies that are starving the housing market of inventory for sale.
Given the fact that an estimated 370,000 California homeowners are delinquent, more than 72,000 properties are in foreclosure, and nearly 47,000 properties are bank-owned, there “should” be plenty of inventory. Instead, market activity is at its lowest level in four years for the following reasons:
- Nearly 2 million California homeowners remain underwater — 1.1 million of them by more than 25 percent. That means 20 percent or more of all California homeowners cannot materially participate in this housing market (outside of a short sale).
- Short sales are likely declining due to government policies. The $25 billion National Mortgage Settlement has largely been fulfilled, taking the pressure off the five largest banks to conduct shorts sales. Also, the political football in the California Legislature over the fate of SB30, the California version of the extension of the federal mortgage debt relief act, is likely depressing short-sale activity.
- Rising prices and low inventory create a seller’s market, so homeowners who do not have to sell are waiting on the sidelines to take advantage of rising prices.
Given these factors, the rapid price increases are likely to fizzle out sooner rather than later.
Sean’s Take - Founder/CEO, PropertyRadar
I’ve long believed that the popular use of median sales prices as an indicator of home price direction is misplaced. Median sales price is an interesting measure of what sold in a particular month, and how that compares to prior periods, but it is a nearly meaningless indicator of home values overall. While it is extremely clear to me that actual home prices have been heading up throughout most of the state, no one should be looking at median sales price as an indicator of how much the value of their home has changed.
