No Shadow Inventory of Bank Owned Homes

Foreclosure Investors Still Finding Discounts at Trustee Sale
Discovery Bay, CA, October 13, 2009 - PropertyRadar (www.propertyradar.com), the only website that tracks every California foreclosure and provides daily auction updates, issued its monthly California Foreclosure Report for September 2009. This month's report features not only a new look but an important new statistic - Bank Owned (REO) Inventory. By looking at the number of foreclosures the banks have taken back and subtracting those that have since resold, we are able to show the number of foreclosures the banks have held as inventory over time. That inventory steadily increased through September 2008, at which point the number of properties banks resold regularly exceeded the number they took back at trustee sale. With 90,365 properties in inventory, banks currently carry about 4.77 months of supply, however, it takes the banks on average 7.33 months to dispose of a bank-owned home, thus current inventory is less than should be expected from normal operations given current foreclosure volumes. Bottom line - there is no "shadow" inventory of bank-owned homes being intentionally withheld from the market.
Foreclosure Filings
Prior Month
Prior Year 1.08%123.44%
Notice of Trustee Sale
Prior MonthPrior Year-5.10%64.97%
Foreclosure filings in September were relatively flat from the prior month, though considerably higher year over year due to the dramatic drop in filings in September 2008, after CA Senate Bill 1137 went into effect requiring lenders to contact borrowers before filing a Notice of Default. In addition to SB 1137, Freddie Mae and Fannie Mac went into conservatorship, and U.S. Treasury Secretary, Henry Paulson, announced the Troubled Asset Relief Program one year ago, both of which have since had impacts on foreclosure filings.

8-Apr8-May8-Jun8-Jul8-Aug8-Sep8-Oct8-Nov8-Dec9-Jan9-Feb9-Mar9-Apr9-May9-Jun9-Jul9-Aug9-Sep45,24143,85243,58041,86043,50416,74617,36121,85443,97440,58049,79958,62347,33742,20247,09447,52837,01837,41730,35835,23936,21240,12537,32919,67426,40228,46628,44824,89021,14634,55931,55643,35530,71140,75734,20232,457
Foreclosure Outcomes
Back to Bank (REO)
Prior Month. Prior Year
-8.61%. -40.61%
Cancellations
Prior Month. Prior Year
-13.47%. 35.85%
Sold to 3rd Party
Prior Month. Prior Year
3.27%. 215.38%
Overall foreclosure sales remain depressed since government intervention began in September 2008, though the percentage of foreclosures being sold to 3rd parties, typically investors, has risen dramatically. Despite expectations that cancellations would have started rising dramatically as homeowners successfully completed 3 month trial periods under the Home Affordable Modification Program, we instead see cancellations decreasing with no clear sign to date that the program is having any impact on foreclosures.

Foreclosure Inventories
Scheduled for Sale
Prior Month Prior Year
6.92% 137.03%
Bank Owned (REO)
Prior Month Prior Year
-2.76% -41.80%
The number of properties on the brink of foreclosure continues to increase and has more than doubled from a year ago. With a smaller percentage of scheduled foreclosures actually being sold due to postponements at the trustee sale, while at the same time seeing strong sales of bank-owned (REO) properties, banks have managed to reduce their inventory by 41.8 percent from a year earlier. With the banks reselling an average of 18,943 homes a month in the 3rd quarter, and an average time to resell of 7 months (given the time taken for eviction, repairs, and resale), we believe there is essentially NO shadow inventory of bank-owned homes at this time. Moving forward there are more loans that are delinquent, in default, and scheduled for trustee sale than ever before, which would typically lead to a significant rise in foreclosure sales. We do not believe this increase is likely in the near future given the continued political pressure on banks not to foreclose.

Foreclosure Discounting

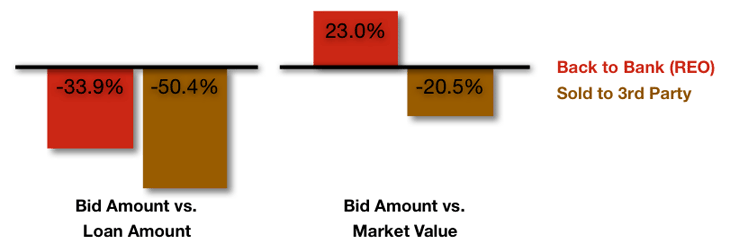
Foreclosures continue to be sold at trustee sales at a considerable discount to both the outstanding loan balance and the current estimated fair market value. As we saw in foreclosure outcomes, the lure of an average 20.5 percent discount to fair market value has dramatically increased the number of properties sold to 3rd party investors. At the same time, it is very clear why more properties aren't purchased at auction - with banks pricing the properties they end up taking back as REO an average 23 percent more than the current market value.
Foreclosure Sales by Loan Origination Date

Nearly 91 percent of foreclosure sales in September were for loans that were made between January 2005 and December 2007. With property values now well below 2004 levels in many parts of the state, it remains surprising that relatively few loans made in 2004 have been foreclosed on. Also notable is the decline in foreclosures on loans that were made after the significant credit tightening that began in August 2007.
Foreclosure Activity By County

CALIFORNIA FORECLOSURE REPORT METHODOLOGY
Rankings are based on population per foreclosure sale.
NDF indicates the number of Notices of Default that were filed at the county, and NTS indicates filed Notices of Trustee Sale.
Sales indicate the number of properties sold at foreclosure auction. Percentage changes are based on monthly Sales. The data presented by PropertyRadar is based on county records and individual sales results from daily foreclosure auctions throughout the state-not estimates or projections.


