Is San Francisco Bay Area's Challenging Housing Market a Factor in the Region’s Employment Growth Slowdown?
Jobs are Plentiful, Affordable Homes are Not
May 2017 Home Sales Unchanged from May 2016
Median Home Price Up 3.5 Percent Y-o-Y to $815,000, Despite Month-over-Month Declines in Four of Nine Counties
CALIFORNIA, JULY 13, 2017 –The San Francisco Bay Area kicked off the summer selling season in May 2017 with an 18.0 percent jump in home and condominium sales from April. Looking back over a longer period, May 2017 home sales were flat compared to May 2016 and nearly identical to 2007 sales.
“San Francisco Bay Area home sales were nearly unchanged relative to a year ago,” said Madeline Schnapp, Director of Economic Research for PropertyRadar. “Sluggish sales in the face of rising prices has been a consistent theme for over five years. Healthy job growth has increased demand for homes, while low inventory and cheap debt have led to rising prices, exacerbating affordability. That may be changing soon due to a regional slowdown in job growth colliding with unbelievably high Bay Area home prices.”
At the county level, sales were mixed. San Francisco, Alameda, and Marin counties posted the largest annual sales gains of 9.1, 8.9, and 6.2 percent, respectively. Meanwhile, Santa Cruz, San Mateo, and Sonoma counties posted the largest annual sales declines of 13.8, 8.5, and 6.2 percent, respectively.
The San Francisco Bay Area median home price (single-family residence) was $815,000 in May 2017, down 2.4 percent from April 2017, but up 3.5 percent from $787,750 in May 2016. At the county level, in May 2017 median home prices ranged from a low of $390,000 in Solano County to a high of $1.4 million in San Mateo County.
“Median home prices in the San Francisco to Santa Clara corridor have sailed past the million-dollar mark topping out at $1.4 million in San Mateo County,” said Schnapp. “It is stunning to compare what $1.4 million can buy you in various parts of the Bay Area. In San Mateo County, $1.4 million will buy you a 2-bedroom, 1-bath, 1,000 square foot home built in 1946 on a 5,000 square foot lot. That same $1.4 million will buy you a relatively new 4-bedroom, 3-bath, 3,500 square foot home, on a 1/2 acre lot in Sonoma County.
”At the county level, median home prices were lower for the month in four of the nine Bay Area counties, Alameda (-1.4 percent), Contra Costa (-1.6 percent), Marin (-3.0 percent), and San Francisco (-2.8 percent). Prices were unchanged in San Mateo County.
“The monthly decline in median home prices in several Bay Area counties was a surprise and maybe signaling a price ceiling,” said Schnapp. “As the Bay Area housing market approaches its seasonal peak, we would expect that prices would continue to rise, but that hasn’t always been the case this year.”
“Last month we wrote about similar conditions in nearby Reno, Nevada,” said Schnapp. “Some of Reno’s housing affordability crisis may be attributed to San Francisco Bay Area residents cashing out and moving out of state.
”Compared to a year ago, May 2017 median home prices were up in eight of the nine Bay Area counties. San Mateo County was home to the largest annual price increase of 14.2 percent followed by Santa Cruz County with an annual gain of 12.0 percent. In three of the nine Bay Area counties, San Francisco, San Mateo, and Santa Clara, median home prices topped $1.25 million.
San Francisco Bay Area Median Home Prices by County (Single Family Residence)
Source: PropertyRadar, 2017
Is the slowdown in San Francisco Bay Area job growth due to home affordability and availability? Maybe.
When we took a closer look at the 2017 economic drivers of the real estate market in the San Francisco Bay Area, some interesting trends in employment popped up,” said Schnapp. “After losing hundreds of thousands of jobs during the recession, as the economy recovered and from 2011 through the end of 2016 employment growth was very strong in the region. According to the U.S. Bureau of Labor Statistics, the number of employees in the San Francisco and San Jose Metropolitan Statistical Areas (MSAs) grew by nearly 650,000. Not surprisingly, in these two MSA regions, employment levels have surpassed all previous employment peaks dating back to the early 1990s.”
“Strong employment growth increases the demand for housing which puts upward pressure on home prices,” said Schnapp. “That is exactly what happened during the period from 2011 to 2016. In the first five months of 2017, however, the number of employees in the San Jose MSA fell by more than 4,000. In the past two months employment is down by 1,500 in the San Francisco MSA. Some experts say the San Francisco Bay Area has reached full employment. If that is the case, then home prices may have reached a top until employment growth resumes.”
“In an unusual twist of economic outcomes, the decline in the Bay Area’s employment growth may not be due to a slowdown in economic growth but instead may reflect job seekers looking elsewhere because of the cost of housing,” said Schnapp. “We spoke to several business owners this past month who said they are having difficulty filling jobs because of the cost of housing in the Bay Area.”
“In Cupertino, Apple’s new behemoth office park will hold 12,000 employees which will only exacerbate nearby housing affordability, as well as traffic congestion. Apple lists over 600 jobs on its website in the Santa Clara/ Cupertino region. Meanwhile, Facebook announced a plan to build 1,500 apartments for employees.
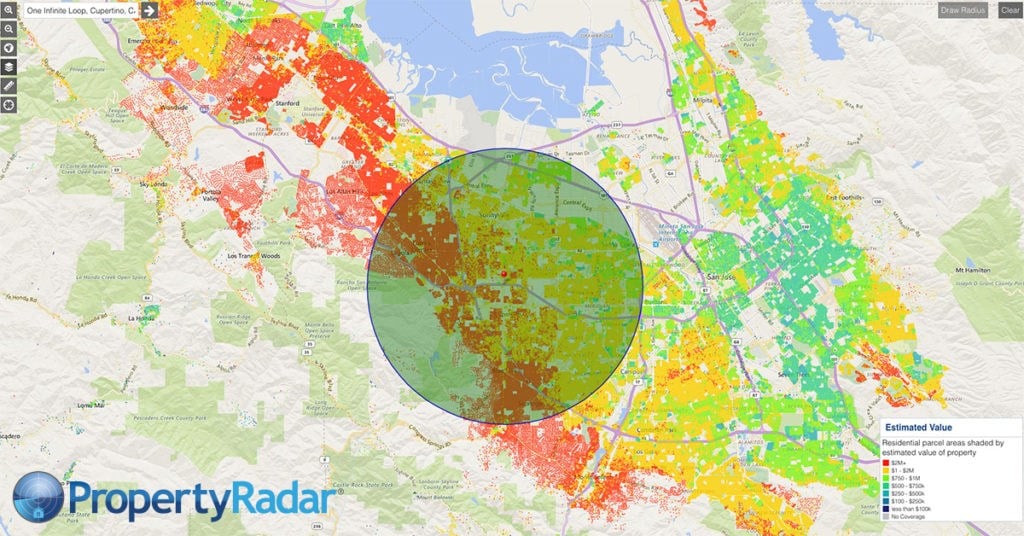
Of the 88,972 single-family residences within a 5-mile radius of Apple’s new headquarters located at One Infinite Loop in Cupertino, California, only 488 homes (0.54 percent) have an estimated value below the San Francisco Bay Area median price of $815,000.
Within 5-miles of Apple's new HQ, only 488 homes (out of 88,972) have an estimated value below $815,000.In Reno, Nevada, a similar explosion of high-skilled employees working at Tesla's new $5 billion Gigafactory has led Tesla to partner with the University of Nevada to find temporary housing for its employees utilizing its dormitories at $35.00 per night.”
San Francisco Bay Area Home Sales (9-County Region)*
San Francisco Bay Area Home Sales – Total Single-family residence and condominium sales. Sales are illustrated by month from 2005 to current and are divided into distressed and non-distressed sales. Distressed sales are the sum of short sales, where the home is sold for less than the amount owed, and REO sales, where banks resell homes that they took ownership of after foreclosure. All other sales are considered non-distressed.
*Note: The San Francisco Bay Area is a nine-county region that includes the following counties: Alameda, Contra Costa, Marin, San Francisco, San Mateo, Santa Clara, Santa Cruz, Solano, and Sonoma. Previous San Francisco Bay Area home sales and median price reports did not include Solano, Sonoma, and Santa Cruz counties.
San Francisco Bay Area Year-over-Year Home Sales
San Francisco Bay Area Year-over-Year Home Sales - Single-family residences and condominiums sold during the same month for the current year and prior years divided into distressed and non-distressed sales.
*Note: The San Francisco Bay Area is a nine-county region that includes the following counties: Alameda, Contra Costa, Marin, San Francisco, San Mateo, Santa Clara, Santa Cruz, Solano, and Sonoma.
San Francisco Year-to-Date Home Sales (January through May Totals)
San Francisco Bay Area Year-to-Date Home Sales – The sum of January through May sales of single-family residences and condominiums for the current year and prior years divided into distressed and non-distressed property sales.
*Note: The San Francisco Bay Area is a nine-county region that includes the following counties: Alameda, Contra Costa, Marin, San Francisco, San Mateo, Santa Clara, Santa Cruz, Solano, and Sonoma.
San Francisco Bay Area Median Home Prices (Year-over-Year February Comparisons)
Median Sales Price – Median sales price of a single-family home by county in the nine San Francisco Bay Area counties (Alameda, Contra Costa, Marin, San Francisco, San Mateo, Santa Clara, Santa Cruz, Solano, and Sonoma).
PropertyRadar Report Methodology
California real estate data presented by PropertyRadar, including analysis, charts, and graphs, is based upon public county records and daily trustee sale (foreclosure auction) results. Items are reported as of the date the event occurred or was recorded with the California County. If a county has not reported complete data by the publication date, we may estimate the missing data, though only if the missing data is believed to be 10 percent or less of all reported data.
About PropertyRadar
With a mission to make targeted local marketing easy, PropertyRadar is the leading property market intelligence and direct marketing platform for California Investors, Realtors®, and Real Estate Professionals who desire to leverage enhanced public records data to grow their business.
Over 10,000 Realtors®, Investors, and Real Estate Services Professionals have turned to PropertyRadar in CA, AZ, NV, OR & WA to discover market opportunities and connect with their prospects.
PropertyRadar (previously known as ForeclosureRadar) is a web-based subscription service providing the leads, data, analysis, marketing, alerts, and automation needed to find opportunities, reduce risk, and increase productivity.
© PropertyRadar 2017
