Normal Seasonal Forces Push California Real Estate Sales Lower
January Sales Down 23.4 Percent from December
Median Price Falls 2.6 Percent
January 2015 California single-family home and condominium sales fell 23.4 percent to 22,850 from 29,821 in December 2014. On a year-over-year basis, sales were down 6.1 percent. Regionally, year-over-year sales were down 8.4 percent across the nine Bay Area counties, 4.1 percent in Southern California, and 10.1 percent in Central California.
“Seasonal forces typically depress January sales,” said Madeline Schnapp, Director of Economic Research for PropertyRadar. “Still, January 2015 sales are the lowest January sales since 2008, despite near record low mortgage interest rates.”
The median price of a California home was 370,000 dollars in January, down 10,000 dollars, or 2.6 percent, from 380,000 dollars in December 2014. Of the 26 largest California counties, median prices fell for the month in all but 5 counties.
“Median home prices also declined from December to January,” said Schnapp. “The fall-off in prices appears to be seasonal and not necessarily indicative of a larger trend.”
In California, year-over-year, median home prices were up 22,000 dollars, or 6.3 percent, from January 2014. Regionally, year-over-year median prices rose 5.0 percent across the nine Bay Area Counties, 7.8 percent in Southern California and 3.7 percent in the Central Valley.
With the decrease in median home prices, the number of homeowners in a negative equity position increased 2.8 percent to 1,015,000, the highest level since October 2014. As a result, approximately 11.7 percent of California homeowners owed more than their home was worth, up from 11.4 percent in December. Despite the increase in January, the number of negative equity homeowners has declined more than 25 percent from a year ago.
Consistent with the overall decrease in January sales, cash, flip, and institutional investor sales posted declines in January. Foreclosure notices also edged lower.
Specifically:
- Cash sales were 5,704 in January, down 15.8 percent from December and represented 25.0 percent of total sales. Cash sales have been steadily declining since reaching a peak of 40.0 percent of total sales in August 2011. Since then, cash sales are down nearly 60.0 percent. Flip sales total 969 in December, gaining 1.9 percent for the month, but were down 36.0 percent for the year.
- Flip sales are defined as properties that have been resold within six months. Flip sales comprised 3.5 percent of total sales in December, down 0.1 percent from November. Flip sales peaked in May 2013 at 5.1 percent of total sales and have declined 49.0 percent since then. Within the 26 largest counties in California, Fresno, Solano and Sacramento had the highest percentage of flips at 5.9, 4.8 and 4.5 percent, respectively.
- Institutional Investor LLC and LP purchases in January totaled 1,078 down 3.5 percent for the month but up 1.9 percent from January 2014. Over the longer term, institutional investor demand has retreated due to the lower return on investment and dwindling supply of distressed properties for sale. Purchases are down 51.5 percent since peaking in December 2012. Similarly, Trustee Sale purchases by LLC and LPs are down 85.9 percent from their October 2012 peak.
- Foreclosure starts, Notices of Default (NODs), were down 0.9 percent from January to December and were down 22.2 percent from January 2014. The monthly decrease is in line with the longer-term downward trend. Foreclosure Sales fell 1.2 percent for the month and were down 23.3 percent for the year.
“While California home sales have been slowing for more than a year, the steady increase in jobs throughout much of 2014 should help,” said Schnapp. “If the job market continues to improve in 2015, we might see an increase in demand pushing both sales and prices higher this spring.”
Home Sales
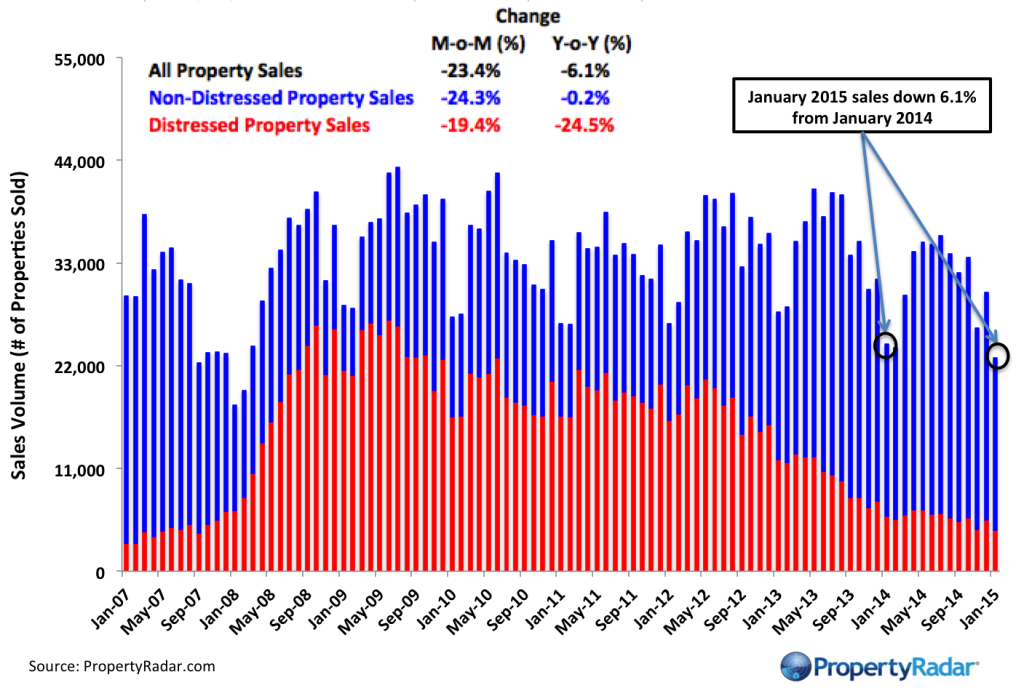
Home Sales - Single-family residence and condominium sales by month from 2007 to current divided into distressed and non-distressed sales. Distressed sales are the sum of short sales, where the home is sold for less than the amount owed, and REO sales, where banks resell homes that they took ownership of after foreclosure. All other sales are considered non-distressed.
Year-over-Year Home Sales
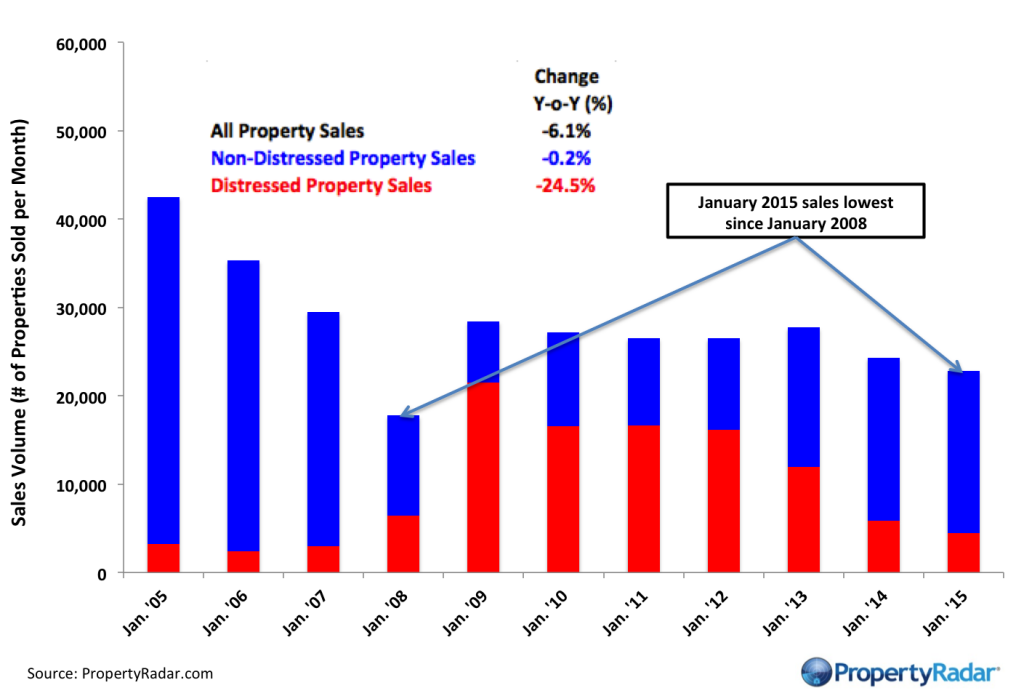
Year-over-Year Home Sales - Single-family residences and condominiums sold during the same month for the current year and prior years divided into distressed and non-distressed sales.
Median Sales Prices vs. Sales Volume
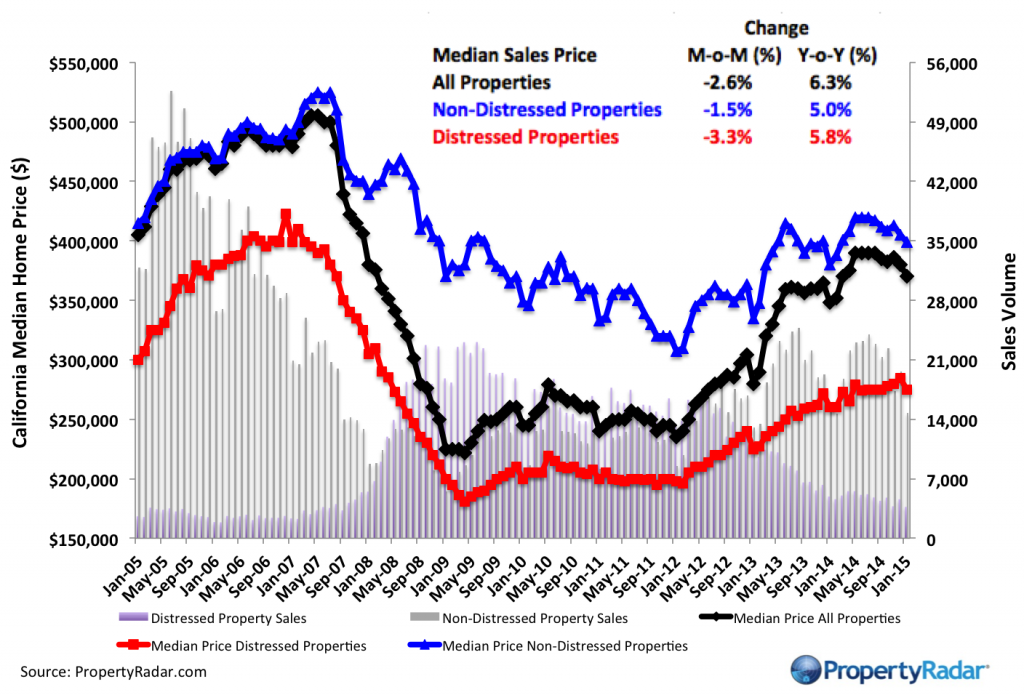
Median Sales Price vs. Sales Volume - Median sales price (left axis) of a California single family home versus sales volume (right axis), by month from 2005 to current. Median sales prices are divided into three categories: All single-family homes (blue line), distressed properties (red line), and non-distressed properties (green line). Monthly sales volume (right axis) are illustrated as gray and lavender bars. The gray bars are distressed sales and the lavender bars are non-distressed sales.
California Homeowner Equity
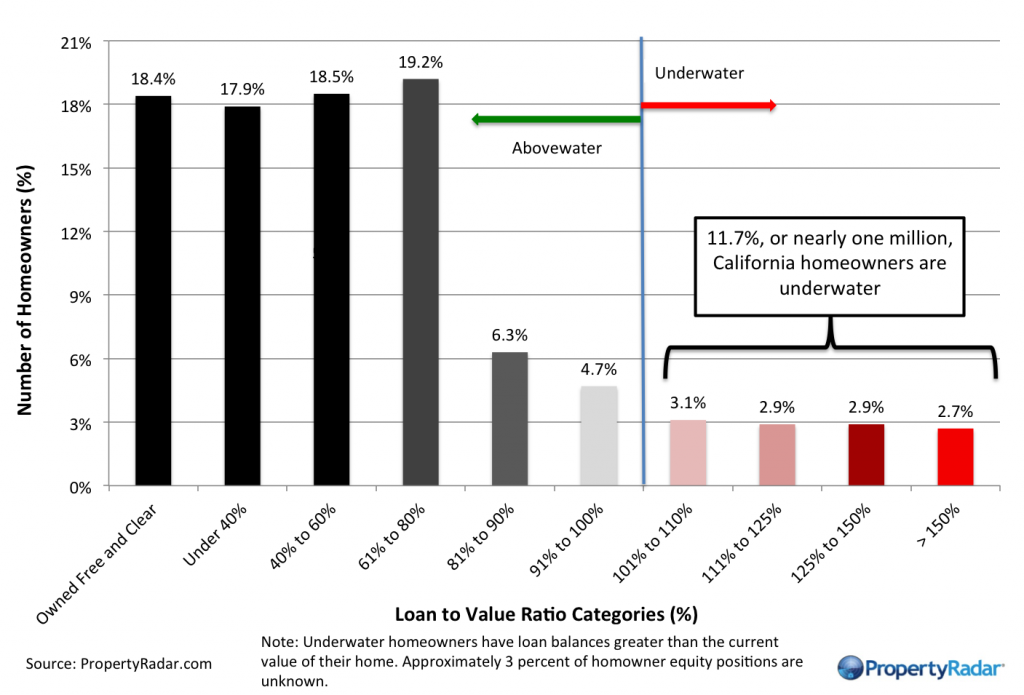
California Home Owner Equity - A model estimate of California homeowners segregated into various categories of levels of homeowner equity for a given month. Homeowner numbers represent a percentage of total California homeowners.
Cash Sales
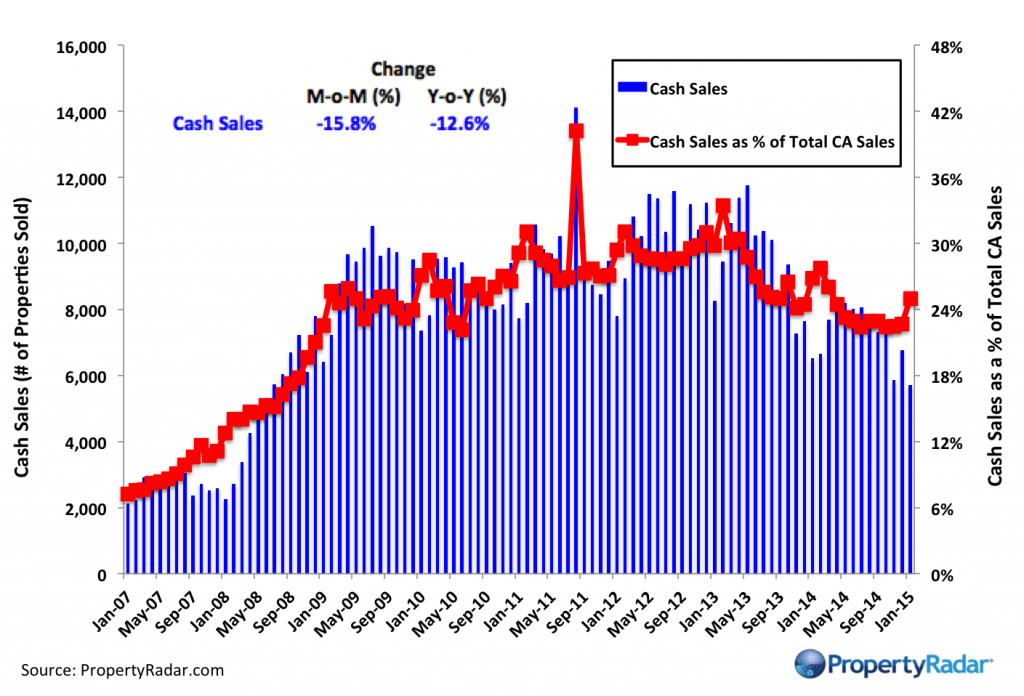
Cash Sales - The blue bars (right axis) illustrate cash sales of single-family residences and condominiums by month. The red line (left axis) illustrates cash sales as a percentage of total sales by month.
Flipping
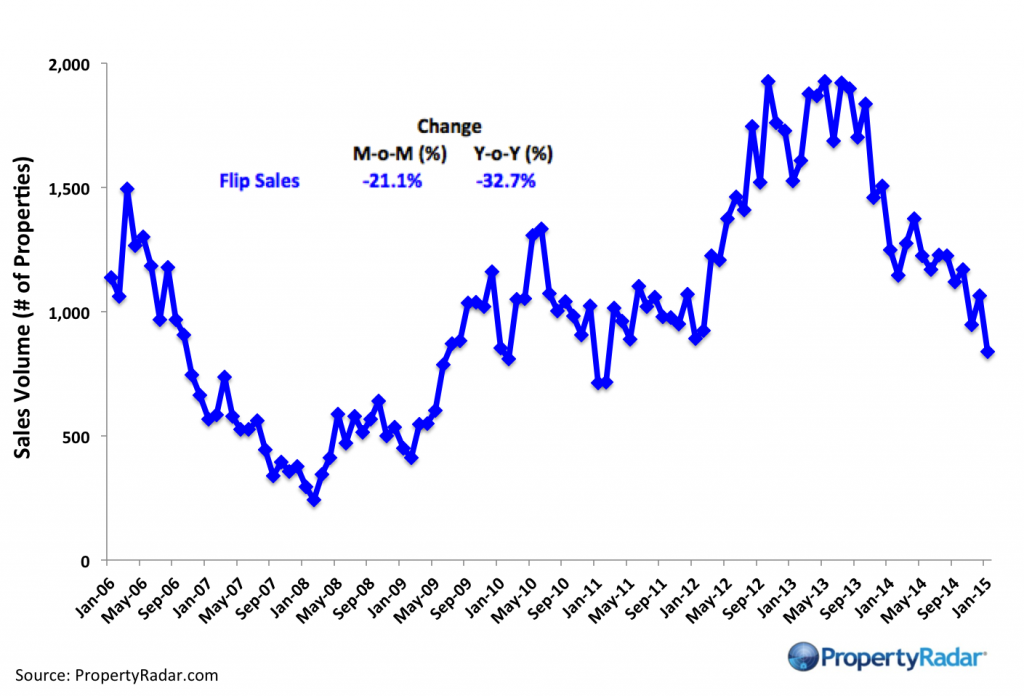
Flipping – The number of single-family residences and condominiums resold within six months.
Market Purchases by LLCs and LPs
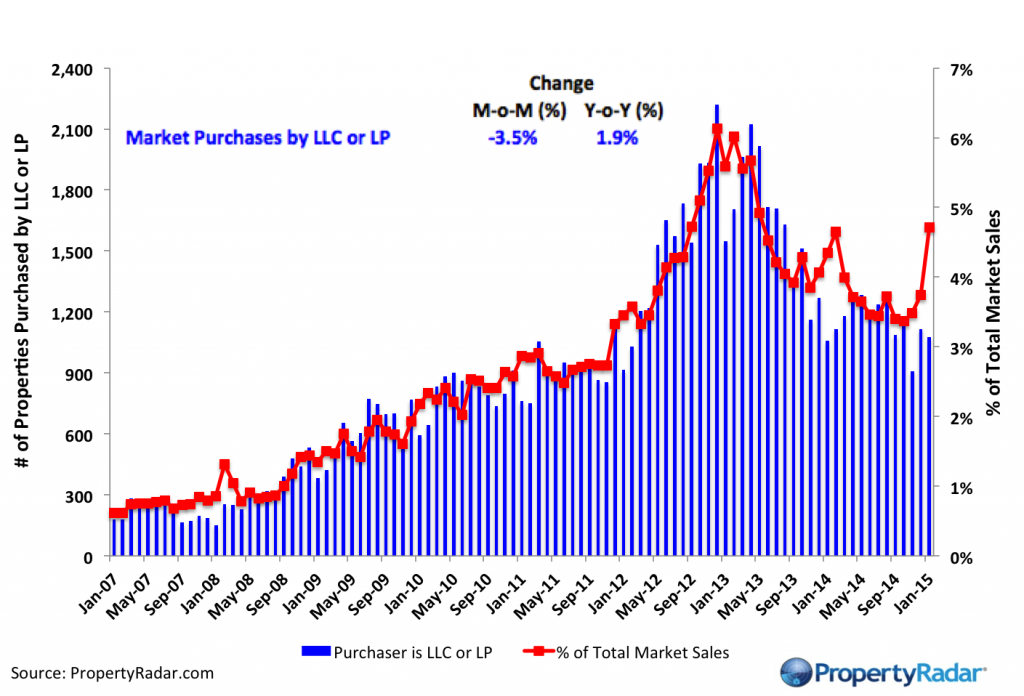
Market Purchases by LLCs and LPs - The blue bars (right axis) illustrate market purchases of single family residences and condominiums by LLCs and LPs from 2007 to current. The red line graph (left axis) illustrates LLC and LP purchases as a percentage of total sales by month.
Market Sales by LLCs and LPs
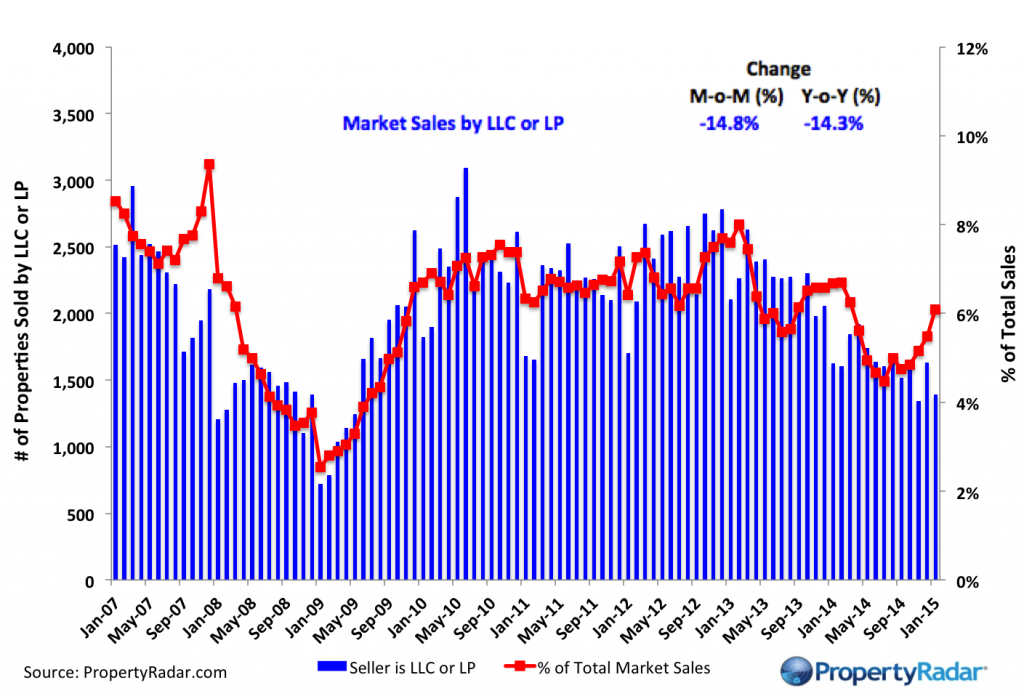
Market Sales by LLCs and LPs - The blue bars (right axis) illustrate market sales by LLCs and LPs of single-family residences and condominiums by month. The red line graph (left axis) illustrates sales as a percentage of total sales by month.
Trustee Sale Purchases by LLCs and LPs
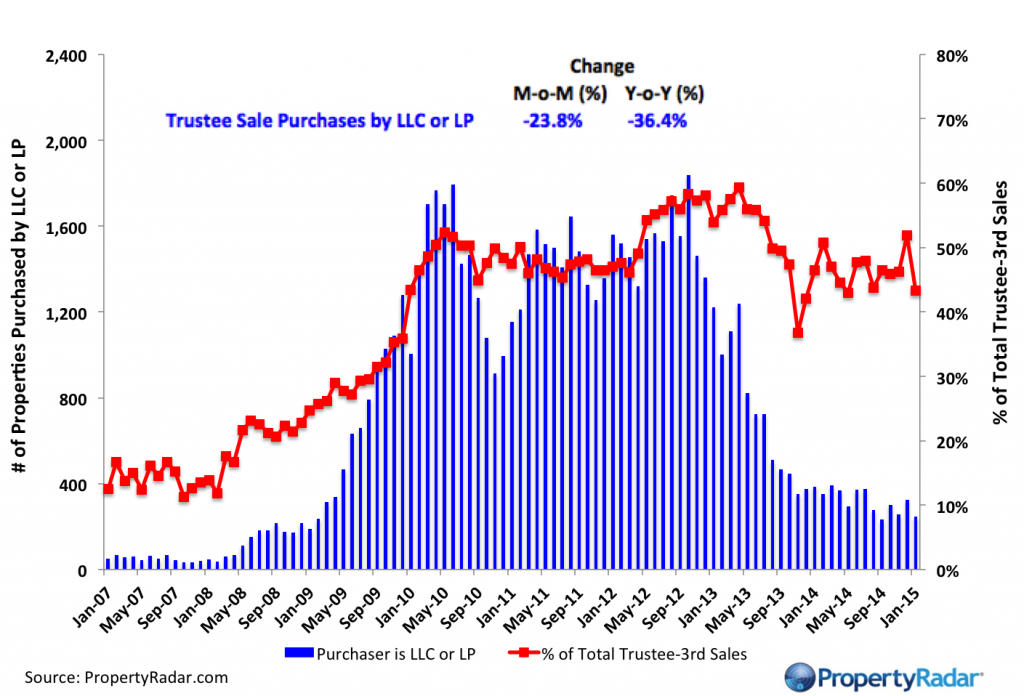
Trustee Sale Purchases by LLCs and LPs - The blue bars (right axis) illustrate trustee sale purchases (foreclosure sales) of single-family residences and condominiums by LLCs and LPs from 2007 to current. The red line graph (left axis) illustrates purchases as a percentage of total trustee sales by month.
Foreclosure Notices and Sales
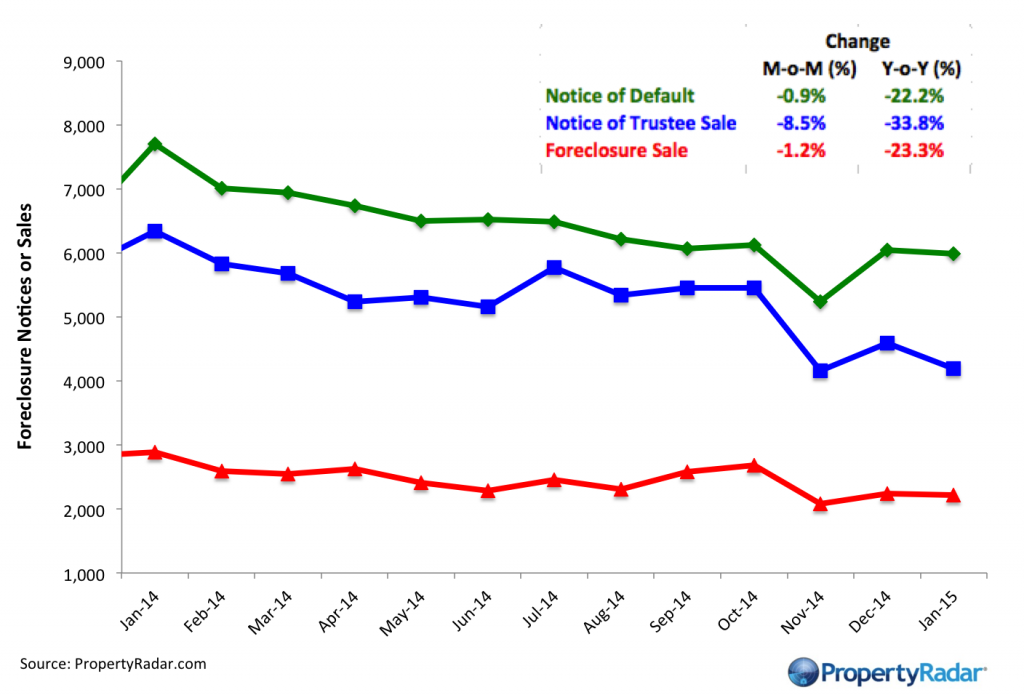
Foreclosure Notices and Sales - Properties that have received foreclosure notices — Notice of Default (green) or Notice of Trustee Sale (blue) — or have been sold at a foreclosure auction (red) by month.
Foreclosure Inventories
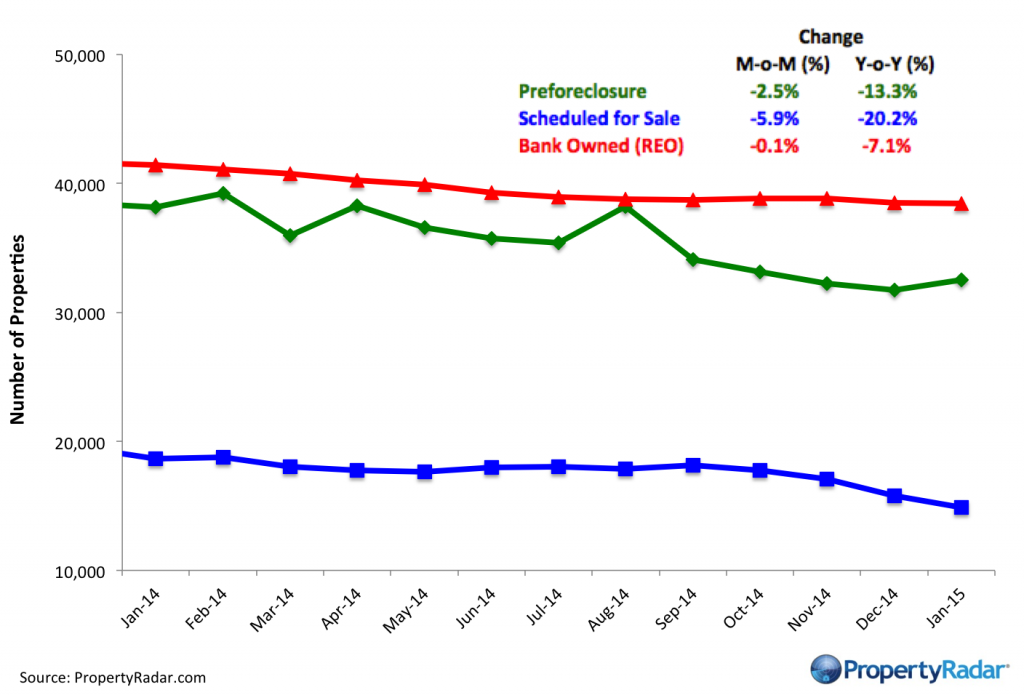
Foreclosure Inventory - Preforeclosure inventory estimates the number of properties that have had a Notice of Default filed against them but have not been Scheduled for Sale, by month. Scheduled for Sale inventory represents properties that have had a Notice of Trustee Sale filed but have not yet been sold or had the sale cancelled, by month. Bank-Owned (REO) inventory means properties sold Back to the Bank at the trustee sale and the bank has not resold to another party, by month.
Real Property Report Methodology
California real estate data presented by PropertyRadar, including analysis, charts, and graphs, is based upon public county records and daily trustee sale (foreclosure auction) results. Items are reported as of the date the event occurred or was recorded with the California county. If a county has not reported complete data by the publication date, we may estimate the missing data, though only if the missing data is believed to be 10 percent or less of all reported data.
