Market Activity
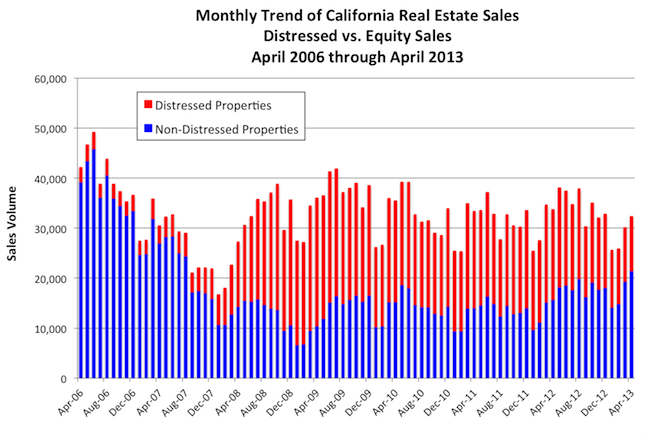
April 2013 California real estate sales – the sum of distressed and non-distressed property sales – declined 4.0 percent year-over-year, continuing the March 2013 year-over-year decline of 12.9 percent. Driving the overall decline in market activity is the tug-of-war between the drop-off in distressed sales and the increase in non-distressed sales. Despite the fact that non-distressed sales have posted healthy increases as a percentage of total sales in the past two months, the gain has not been enough to offset the larger decline in distressed property sales.
The decline in distressed property sales appears to be driven, in part, by the uncertainty surrounding the requirements of the California Homeowner Bill of Rights that depressed foreclosure activity late last year. Also, the new foreclosure prevention guidelines issued by the Office of the Comptroller (OCC) appear to have caused a temporary decline in foreclosure sales. Given the large numbers of California properties in the foreclosure pipeline, the magnitude of the decline in distressed property sales is likely temporary.
Source: PropertyRadar - PropertyRadar.com
In April distressed property sales fell 39.4 percent year-over-year. In contrast, non-distressed sales increased by 36.6 percent year-over-year. While the year-over-year increase in April's non-distressed sales was impressive, the gain was not enough to push overall market activity higher.
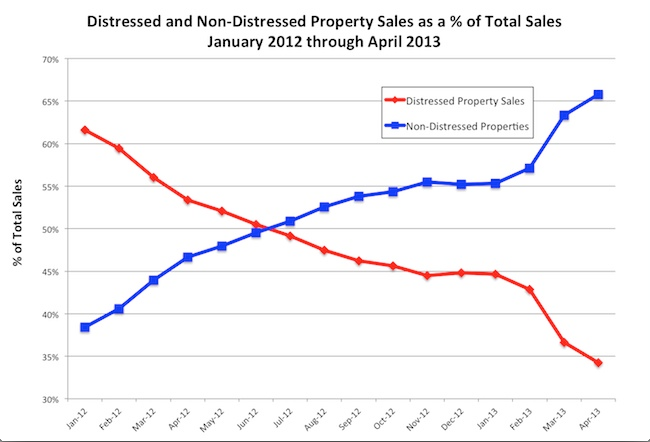
Distressed sales have been declining steadily as a percentage of total sales since the beginning of 2012. In January 2012 distressed sales were 61.6 percent of total sales and ended the year at 44.8 percent of sales. In April 2013, distressed sales were 34.2 percent of total sales, down from 36.6 percent in March. Over the same time period, non-distressed sales started 2012 at 38.4 percent of total sales and ended the year at 55.2 percent of total sales. In April 2013, non-distressed sales were 65.8 percent of total sales, up from 63.4 percent in March.
The recent increase in non-distressed sales as a percentage of total sales is encouraging but needs to rise further if this category of sales is to propel overall market activity higher.
Source: PropertyRadar - PropertyRadar.com
Cash Sales
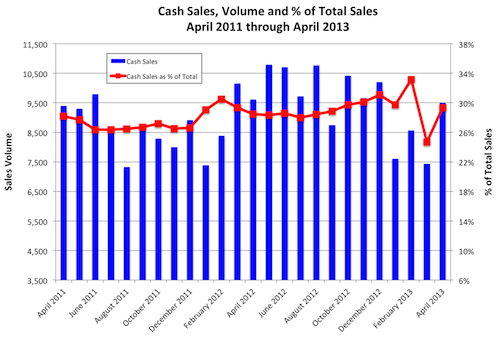
Since 2008, total cash sales have increased dramatically. From 2001 through 2007, cash sales ranged from a low of 27,381 to 51,387 and represented only 6.2 percent to 8.4 percent of total market sales. In 2008, as the housing market collapsed and prices plummeted, real estate investing became more attractive and cash buyers returned to the market. In 2008, cash sales were 57,019, or 15.9 percent of total sales. By 2012, cash sales had swelled to 116,549, or 29.2 percent of total sales, and have stayed in that range ever since. In April 2013 cash sales are 29.3 percent of total sales up from March’s total of 24.7 percent.
Source: PropertyRadar.comI
institutional Purchases
An important component of cash sales is institutional purchases. Reports of institutional investor interest in buying California properties inspired us to take a closer look at institutional purchases of California single-family residences and condominiums from 2006 to 2012 and year-to-date 2013. Specifically, we were interested in identifying institutional purchasers, where the purchase activity was occurring, and whether or not that activity was changing given the rapid increase in California real estate prices.
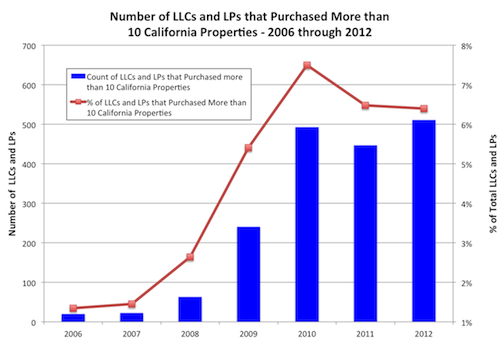
We define institutional purchase activity as transfers in quantities greater than 10 either by a limited liability corporation (LLC) or a limited partnership (LP). We focused on quantities greater than 10 to filter out mom-and-pop investors. In 2012, for example, nearly 8,000 LLCs and LPs purchased California single-family homes and condominiums. Of those, only 511, or 6.4 percent, purchased more than 10 properties. The annual trend of institutional purchases from 2006 through 2012 is illustrated in the following graph. Not surprisingly, the number of LLCs and LPs increased dramatically beginning in 2009 as real estate prices fell and return on investment became increasingly attractive.
Source: PropertyRadar - PropertyRadar.com
The Top-10 Institutional Purchasers
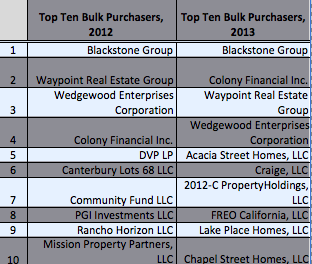
The top ten institutional purchasers of California single-family homes and condominiums in 2012 and year-to-date 2013 are listed in Table 1. Note that the first four companies in the 2012 top-10 list are the same four that appear in the 2013 top-10 list, in a slightly different order. The Blackstone Group topped the list in both years. In fact, in 2012, Blackstone Group’s purchase activity was more twice that of Waypoint Real Estate Group. So far in 2013, Blackstone has purchased nearly one-and-a-half times as many properties as Colony Financial. The next six LLC and LP purchasers in 2012 and 2013 are not the same.
Table 1
Top-10 Institutional Purchasers of
California Single-Family Homes and Condominiums
2012 versus 2013
Source: PropertyRadar – www.propertyradar.com
Top-10 Counties Where LLC and LP Purchases are Concentrated
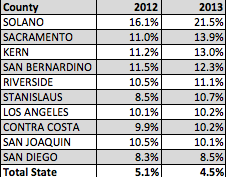
In 2012 and so far in 2013, LLC and LP purchases represented only a small percentage of total transfer activity statewide: 5.1 percent of total transfers in 2012 and 4.5 percent in 2013. When grouped by county, however, it is clear that LLC and LP purchase activity was concentrated in only a few counties but in those counties was a significant percentage of total sales. Solano County, for example, topped the list with LLC and LP purchases representing 16.1 percent and 21.5 percent of total sales in 2012 and 2013, respectively. Sacramento County came in second with LLC and LP purchases representing 11.0 percent and 13.9 percent of total sales in 2012 and 2013, respectively. The top-10 counties with the highest LLC and LP purchases as a percentage of total sales are listed.
Table 2
LLC and LP Purchase Activity
as a Percentage of Total California Sales
(Single Family Residences and Condominiums)
Source: PropertyRadar.com – www.propertyradar.com
So far this year, LLC and LP purchases, as a percent of total sales, have increased in nine out of the 10 counties. Despite rapid price increases, housing prices remain low enough to attract LLC and LP purchasers. Will this trend last? We will continue to monitor these trends closely as cash purchases represent a large percentage of total transaction volume.
Foreclosures
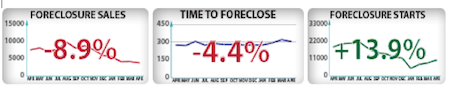
California April Notices of Default (NODs) jumped 13.9 percent and were up 108.0% since the beginning of the year. While the increase in NODs might appear dramatic at first glance, the increase simply reflects a return to a longer-term trend that was interrupted by the implementation of the California Homeowner Bill of Rights, which went into effect on January 1.
Foreclosure filings, on the other hand — Notices of Default plus Notices of Trustee Sale — were up only 1.0 percent for the month and down 45.8 percent for the year.
Source: PropertyRadar - PropertyRadar.com
A great deal of interest was generated by the following graph, which illustrates that the time to foreclose increases with the size of the outstanding loan amount. Specifically, if the loan amount in default is less than $425,000, the time to foreclose averages 315 days. If the loan amount in default is between $580,000 and $729,750, then the time to foreclose averages 619 days, 304 days longer.
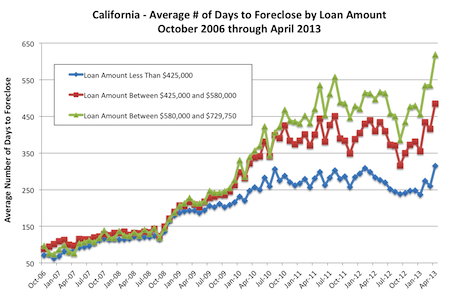
Source: PropertyRadar - PropertyRadar.com
Madeline’s Take - Director of Economic Research, PropertyRadar
While rising home prices and bidding wars make good headlines, the missing piece in these stories is the decline in property sales. It is hard to imagine a sustainable housing recovery with fewer homeowners.
The good news is we believe some of the drop-offs in distressed property sales is temporary, driven by uncertainty surrounding recent legislation and new foreclosure prevention guidelines. Also, non-distressed sales have posted dramatic increases; just not fast enough to offset the decline in distressed property sales. The rising trend in non-distressed sales is likely to continue given the fact that rising home prices reduce negative equity. Large numbers of formerly underwater homeowners can now become both sellers and buyers.
One of the unusual characteristics of today’s housing market is the large percentage of cash purchases by investors and institutions. These purchases are heavily concentrated in markets hit hard by the housing bust and are partially responsible for the sharp run-up in prices in those areas. This trend shows no sign of slowing and investors and institutions will continue to play an important role in the housing market this year.
Inventory, unfortunately, will likely remain scarce. The good news is builders are jumping into the market with both feet. A new home inventory will likely appear in meaningful quantities later this year or early next year. In the meantime, sellers are in the driver’s seat and buyers will continue to face tough competition in inventory-constrained markets.
Sean’s Take - Founder/CEO, PropertyRadar
Institutional investors have been attracted to the California market by the strong return on investment that rental properties have offered since 2008. As prices increase, however, the potential return on new investments declines. As such the rapid increases in prices, we have recently seen are a double-edged sword. On the one hand, the increases reduce negative equity helping underwater homeowners. On the other, they reduce affordability for homebuyers and the potential returns for investors. Sales activity is already being hurt by low inventories, primarily due to government intervention in foreclosures. We need to prepare for further declines in sales volume as prices exceed what homebuyers can afford, and what investors can pay to achieve decent returns.
