Notices of Default (NODs) in California jumped 13.9 percent in April and were up 108.0% since the beginning of the year. While the increase in NODs might appear dramatic at first glance, the increase simply reflects a return to a longer-term trend that was interrupted by the implementation of the California Homeowner Bill of Rights, which went into effect January 1.
Foreclosure filings, on the other hand — Notices of Default plus Notices of Trustee Sale — were up only 1.0 percent for the month and down 45.8 percent for the year.
In general, the longer-term foreclosure trend is down due to the fact that fewer homeowners are defaulting on their loans and the potpourri of government debt-relief programs that have slowed the foreclosure process to nearly 300 days.
Source: PropertyRadar.com
Notices of Trustee Sale and Foreclosure Sale Activity
Notices of Trustee Sale in California fell 10.7 percent in April and 46.0 percent over the past 12 months.
Meanwhile, the state’s foreclosure sales fell 8.9 percent in April and 49.9 percent for the year, reaching their lowest level since February 2007. If we split April foreclosure sales into their respective components — Sold to Third Party and Bank to Bank (RE0) — Sold to Third-party sales were down 17.2 percent in April and 37.0 percent over the past 12 months, while REOs edged up 2.0 percent in April but were down 58.8 percent over the past 12 months.
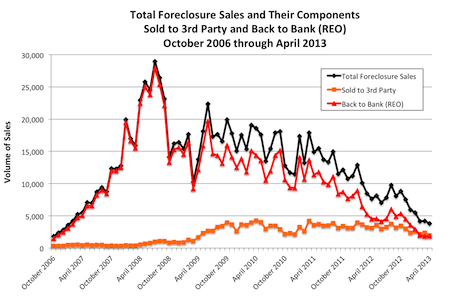
Note: Total foreclosure sales equal the sum of Sold to 3rd Party plus Back to Bank (REO).
Source: PropertyRadar.com
Number of Days to Foreclose Varies Dramatically by Size of Loan
Last month, we decided to look more closely at time-to-foreclose statistics and divided the data into three loan categories. We used the published bid amount as a proxy for the loan amount because the published bid is roughly equal to the amount owed to a bank plus past due payments.
Our three categories were loans less than $425,000, loans greater than $425,000 but less than $580,000, and loans greater than $580,000 but less than $729,750. We selected our loan categories using three of the California Federal Housing Authority’s (FHA) conforming loan limits. This graph illustrates the results:
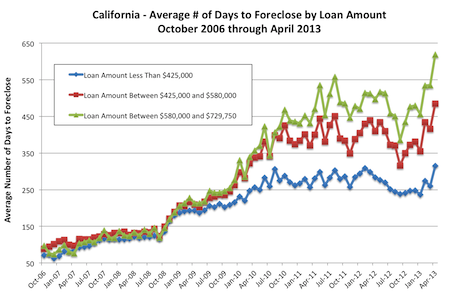
Source: ForeclosureRadar.com
The data shows that prior to January 2009, the number of days to foreclose for the three loan categories was nearly identical. Beginning the following month, however, the number of days to foreclose began to diverge. By August 2010, the difference in the number of days to foreclose had widened to more than 100 days. By April 2013, it took an average of 315 days to foreclose on loans less than $425,000. For loans greater than $580,000 and less than $729,750, the time to foreclose averaged 619 days, 304 days longer than the $425,000 loan category.
Without evidence to the contrary, it appears that more-affluent homeowners are allowed to stay in their homes nearly twice as long as less-affluent homeowners, though that conclusion may be too harsh. Perhaps the difference lies in the fact that more affluent homeowners have the means to tap into resources to help delay foreclosure, or that larger loans on expensive homes are more complex and take longer to disentangle.
We welcome your comments.
April Foreclosure Stats & Trends, by State
For a complete summary of April’s foreclosure stats and trends, please click on the following links:
California foreclosure stats and trends
Foreclosure starts: 10,167 (+13.9%)
Foreclosure sales: 3,824 (-8.9%)
Time to foreclose: 306 days (-4.4%)
Arizona foreclosure stats and trends
Foreclosure starts: 2,908 (-8.9%)
Foreclosure sales: 1,896 (+11.7%)
Time to foreclose: 145 days (+0.0%)
Nevada foreclosure stats and trends
Foreclosure starts: 2,521 (+2.6%)
Foreclosure sales: 787 (+12.1%)
Time to foreclose: 289 days (-8.3%)
Oregon foreclosure stats and trends
Foreclosure starts: 52 (-32.7%)
Foreclosure sales: 23 (-39.5%)
Time to foreclose: 166 days (-6.2%)
Washington foreclosure stats and trends
Foreclosure starts: 2,605 (-6.7%)
Foreclosure sales: 1,752 (+7.6%)
Time to foreclose: 140 days (+9.4%)
Madeline Schnapp
Director of Economic Research
PropertyRadar.com
