Real Property Report - California, February 2014

Sales Retreat in February while Median Prices Edge Higher
California single-family home and condominium sales fell 1.4 percent in February 2014 from January and declined 16.1 percent from February 2013. Last month marked the lowest February sales since 2008. “Rapid price increases and rising interest rates in concert with sluggish income and employment growth have slowed demand…” said Madeline Schnapp, Director of Economic Research for PropertyRadar. “Tougher borrowing standards, elevated prices, increasing borrowing costs, and historically low inventory continue to exert a drag on market activity.
”Despite the decline in sales volume, the February 2014 median price of a California home rose $5,000, or 1.4 percent, to $350,000 from $345,000 in January. On a year-ago basis, median home prices have jumped 21.1 percent. “The uptick in median home prices in February means little as seasonal factors continue to impact both sales and prices,” said Schnapp. “Given the lackluster sales volume, however, median prices are unlikely to see the rapid gains that characterized the first half of 2013.”
The number of California homeowners with more than 10 percent equity in their homes increased 2.3 percent, or nearly 120,000, in February. “The decline in negative equity is certainly good news,” said Schnapp. “But, it is important to keep in mind that 1.2 million California homeowners, or 13.9 percent, remain underwater and will continue to create significant headwinds for the California housing market recovery.
”Institutional Investor LLC and LP purchases gained 1.6 percent for the month but are down 35.4 percent from February 2013. Despite February’s modest gain, LLC and LP purchases were 50.1 percent below their December 2012 peak. “For more than a year now, institutional investors have been gradually reducing their purchases of California real estate,” said Schnapp. “Rising prices have reduced the return on investment, making homes less attractive as an investment option." “In sum, the California housing market continues to improve,” said Schnapp, “just more slowly than most analysts expected, given that we are in the fifth year of an economic recovery.”
Home Sales
.jpeg?width=481&height=276&name=5f4974f75a6d54de9a5b867e_CA-Real-Estate-Sales-Month-4-1%20(1).jpeg)
Home Sales - Single-family residences and condominiums sold by month in California since 2007. Compares distressed (Bank REO resales and short sales) and non-distressed – all other sales.
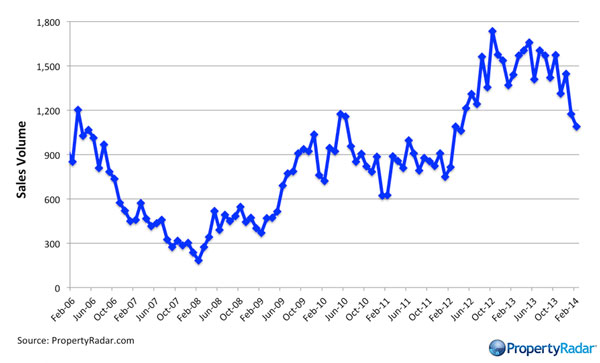
Year-over-Year Home Sales
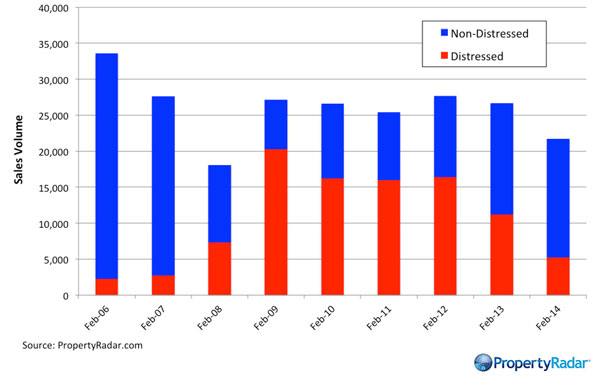
Year-over-Year Home Sales - Single-family residences and condominiums sold in California since 2006. Compares sales during the same month each year for distressed (Bank REO resales and short sales) and non-distressed - all other sales.
Median Sales Prices vs. Sales Volume
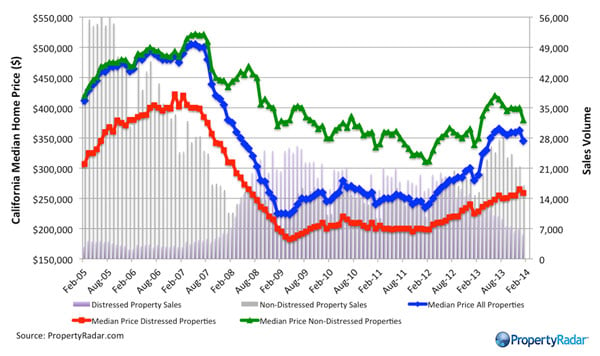
Median Sales Prices vs. Sales Volume - Compares California median prices vs. sales volume by month, from 2005-current. Green, red and blue trend lines show median prices for three categories (distressed, non-distressed, and combined or all). Monthly home sales volume (transactions) are the gray (non-distressed sales) and lavender (distressed sales) bars and is indicated on the right-hand axis.
California Homeowner Equity
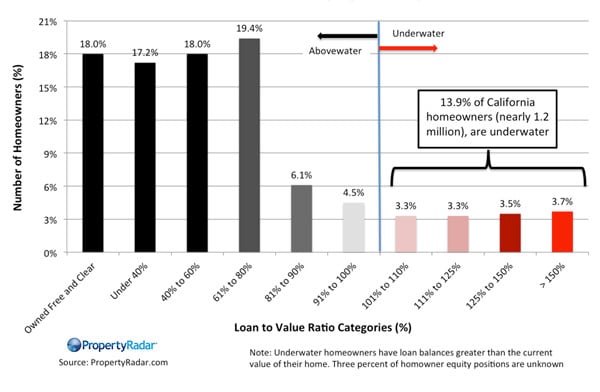
California Homeowner Equity - Compares California homeowners who are above, at, or underwater for the month in this report. Percentages at top of bar columns indicate number of homeowners in the equity position indicated by the percentages at the bottom, underneath the columns.
Cash Sales
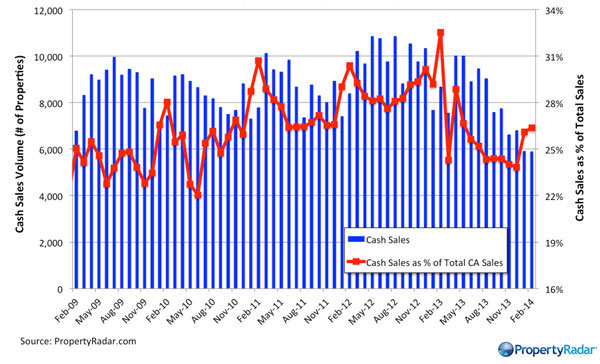
Cash Sales - California home sales paid in cash by month from 2009 to current - single-family residences and condominiums only. Right-hand axis shows cash sales as a percentage of all sales. Left-hand axis shows number of properties purchased with cash.
Flipping
Flipping - Shows sales volume of homes that were purchased then resold within six months, also known as flipping.
Market Purchases by LLCs and LPs
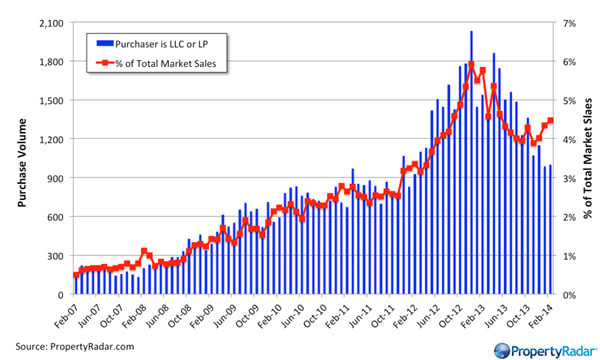
Market Purchases by LLCs and LPs - Right-hand axis shows what percentage of all market purchases were made by owners with LLC and LP designation within ownership name. Left-hand axis indicates the volume, or quantity of home purchases.
Market Sales by LLCs and LPs
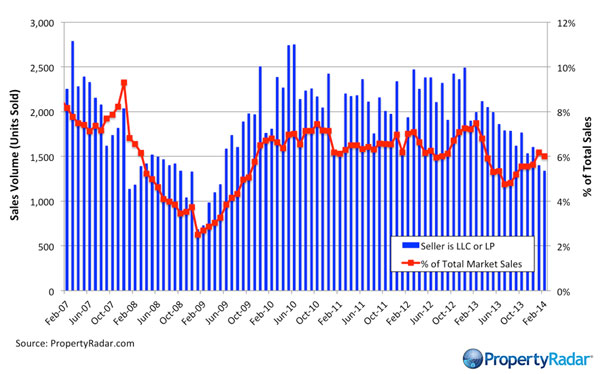
Market Sales by LLCs and LPs - Shows volume of sales that LLCs and LPs during any given month, meaning sales of properties that were publicly listed and sold.
Trustee Sale Purchases by LLCs and LPs
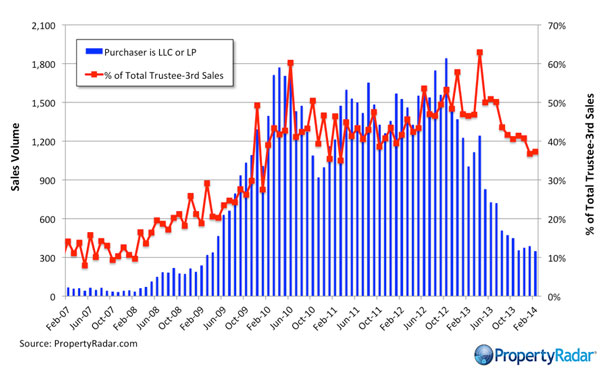
Trustee Sale Purchases by LLCs and LPs - Shows foreclosure purchases made by LLCs and LPs at a trustee sale (auction), by month since 2007. Right-hand axis shows percent of Trustee sales made by LLCs and LPs. Left-hand axis shows sales volume, or transactions made by LLC and LPs. Single-family residences and condominiums only.
Foreclosure Notices and Sales
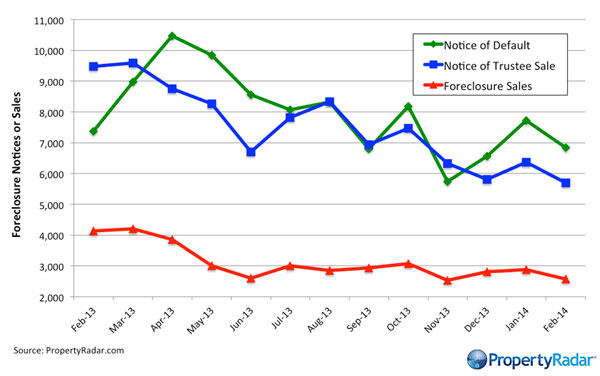
Foreclosure Notices and Sales - Compares the number of Notices of Default (failed to make payment), to Notices of Trustee Sale (property is scheduled to be sold at auction), to Foreclosure Sales (sold at the Trustee Sale, a.k.a. at auction) over the past 12 months.
Foreclosure Inventories
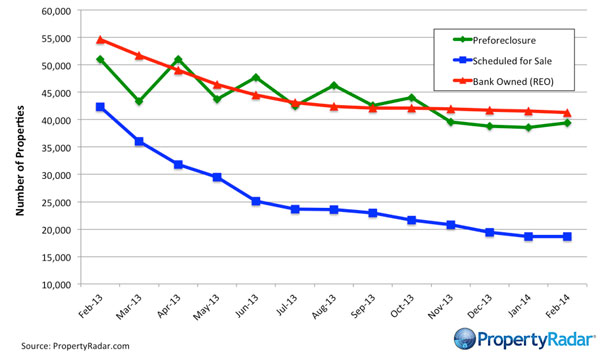
Foreclosure Inventories - Green trend line shows the number of properties in preforeclosure (have received a notice of default, but have not been scheduled for sale yet), blue trend line shows scheduled for sale (received notice of a sale date, at the Trustee Sale), and red trend line have been returned to the bank as an REO – meaning, the property went to the trustee sale (auction) and was not purchased by a 3rd party, therefore it went “back to the bank”.
Real Property Report Methodology
California real estate data presented by PropertyRadar, including analysis, charts, and graphs, is based upon public county records and daily trustee sale (foreclosure auction) results. Items are reported as of the date the event occurred or was recorded with the California county. If a county has not reported complete data by the publication date, we may estimate the missing data, though only if the missing data is believed to be 10 percent or less of all reported data.