October Sales Up 4.4 Percent Month-over-Month
Median Prices Flat
October 2014 California single-family home and condominium sales increased 4.4 percent to 33,376 units from 31,985 in September. Year-over-year, sales were down 5.3 percent from 35,256 sales in October 2013. On a regional basis, for the month, sales were up 2.0 percent in the Bay Area, 4.3 percent in Southern California, and down 1.6 percent in the Central Valley.
The median price of a California home in October was 385,000 dollars, unchanged from September. Median prices have been more or less unchanged since June 2014. On a year-ago basis, median home prices gained 6.8 percent, the smallest gain since May 2012.
“Earlier this year we accurately predicted that 2014 would be a year of lower sales volume and flat prices because home prices rose too far too fast,” said Madeline Schnapp, Director of Economic Research for PropertyRadar. “That’s exactly what’s happened and hopefully by next spring, prices will be more in line with what prospective homebuyers can afford.”
Since 2007, month-over-month median price variations have been impacted heavily by the ratio between non-distressed and distressed sales. For example, from 2008 through 2011, high volumes of distressed sales disproportionately pulled median prices lower. To better measure median price movements we separate distressed property sales and non-distressed property sales. In October, the median price of non-distressed homes was nearly unchanged, falling 0.2 percent. Over the past 12 months, the non-distressed median price increased 3.8 percent. Meanwhile, the median price of distressed homes gained 2.2 percent for the month and was up 8.1 percent from a year ago.
On a county level, 16 of California’s 26 largest counties, or nearly 62 percent, experienced monthly price declines compared to only five in March.
In other California housing news:
- Aggregate negative equity of California homeowners has been unchanged since August due to the fact that price appreciation has either slowed or reversed in many parts of California. Since August, slightly more than 1.0 million California homeowners, or 11.6 percent remain underwater. Historically elevated levels of negative equity will continue to exert a drag on the California real estate market.
- Cash sales totaled 7,311 in October and were 21.9 percent of total sales. Cash sales have been steadily declining since reaching a peak of 40.0 percent of total sales, or 14,028, in August 2011. Since then, cash sales have fallen nearly 50 percent. Within the 26 largest counties in California, cash sales as a percentage of total sales were the highest in two of the most affluent counties, San Francisco and Marin, at 31.7 and 27.6 percent, respectively.
- Flip sales gained 2.0 percent for the month but are down 38.0 percent for the year. Flip sales are defined as properties that have been resold within six months. Flip sales comprised 3.5 percent of total sales in October, unchanged from September. Flip sales peaked in October 2012 at 5.1 percent of total sales and have declined 41.3 percent since then. Within the 26 largest counties in California, Kern, Tulare, and Fresno had the highest percentage of flips at 4.7, 4.3, and 3.9 percent, respectively.
- Institutional Investor LLC and LP purchases edged up 1.9 percent for the month but are down 26.6 percent from October 2013. As the supply of distressed properties dwindle and prices rise, institutional investor demand has retreated due to the lower return on investment. In general, Institutional Purchases have posted consistent monthly declines since peaking in December 2012 and are down 50.0 percent since then. Trustee sale purchases by LLC and LPs are down nearly 82.9 percent from their October 2012 peak.
- Foreclosure starts, Notices of Default (NODs), fell 2.0 percent between September and October and are down 27.3 percent from October 2013. The downward trend extends a longer-term downward trend that began in March 2009. Meanwhile, Foreclosure Sales increased 3.8 percent for the month but are down 12.9 percent for the year.
Home Sales
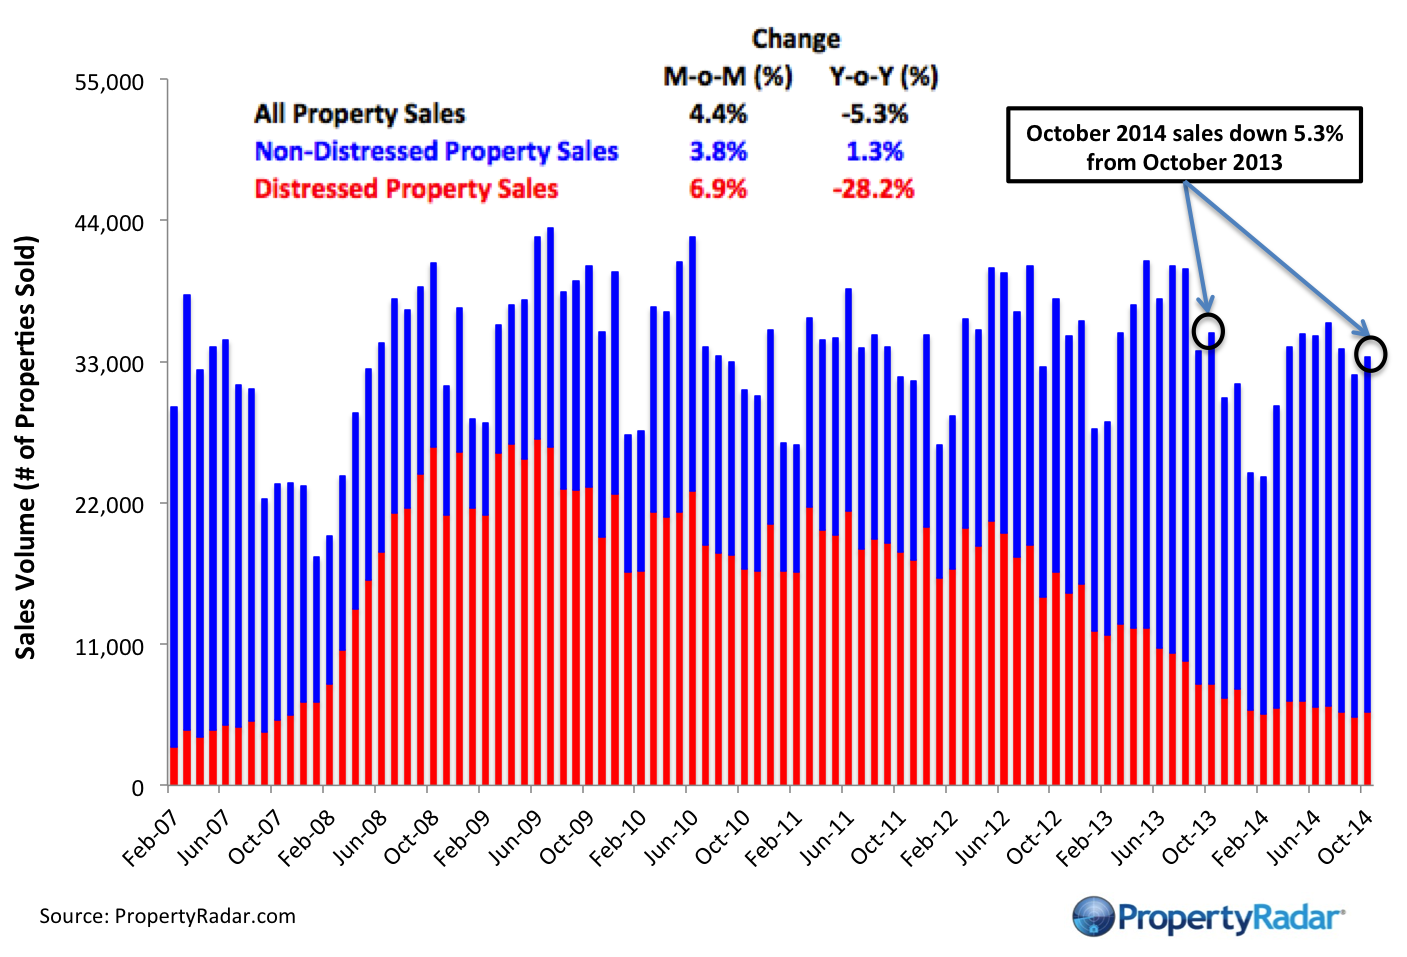
Home Sales - Single-family residence and condominium sales by month from 2007 to current divided into distressed and non-distressed sales. Distressed sales are the sum of short sales, where the home is sold for less than the amount owed, and REO sales, where banks resell homes that they took ownership of after foreclosure. All other sales are considered non-distressed.
Year-over-Year Home Sales
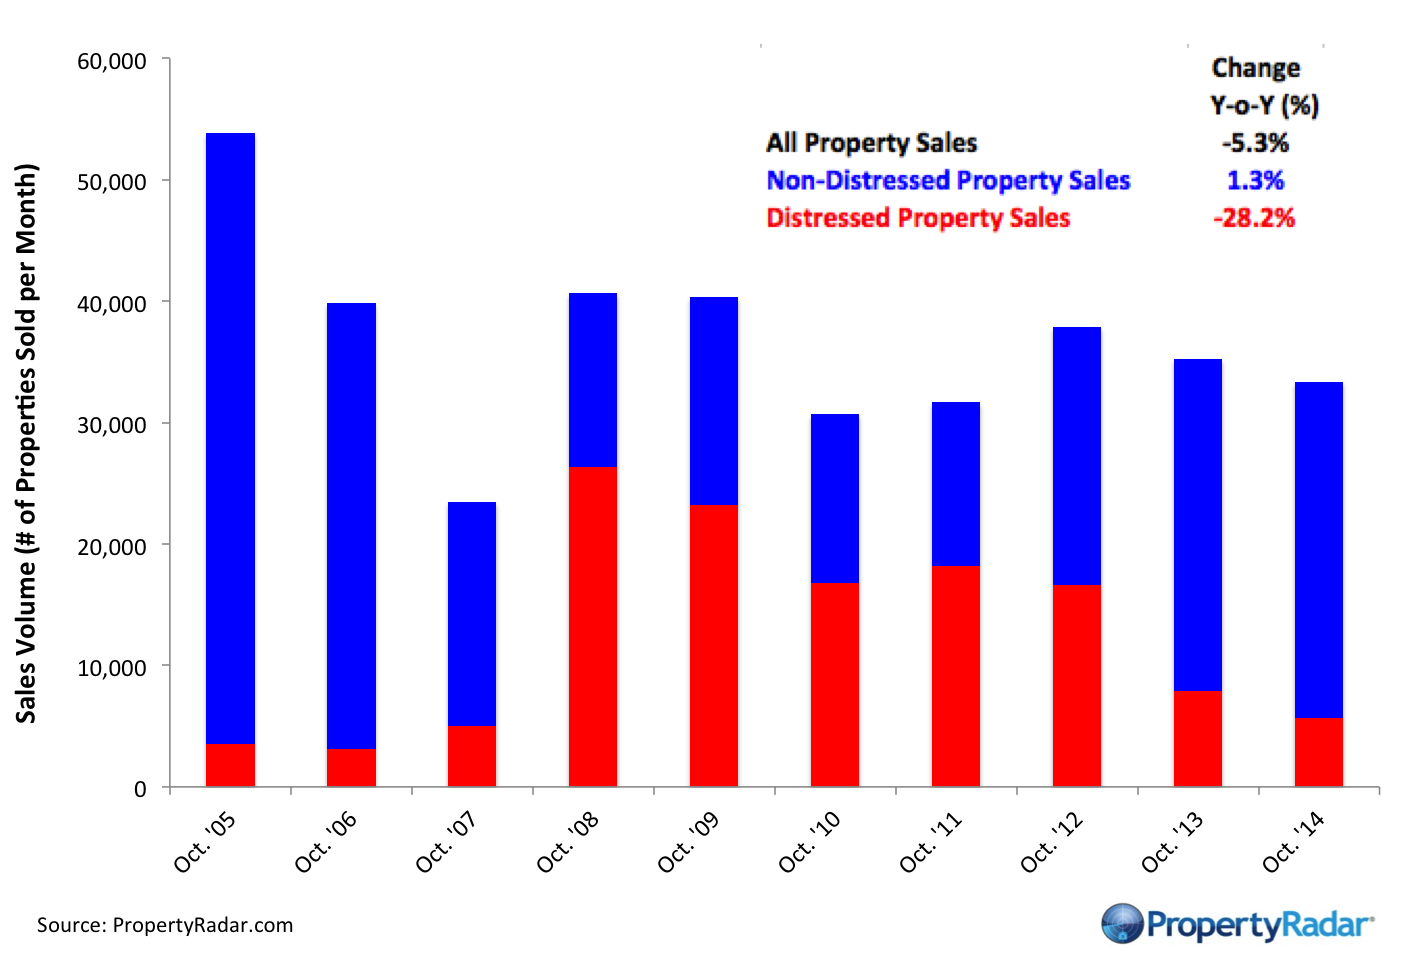
Year-over-Year Home Sales - Single-family residences and condominiums sold during the same month for the current year and prior years divided into distressed and non-distressed sales.
Median Sales Prices vs. Sales Volume
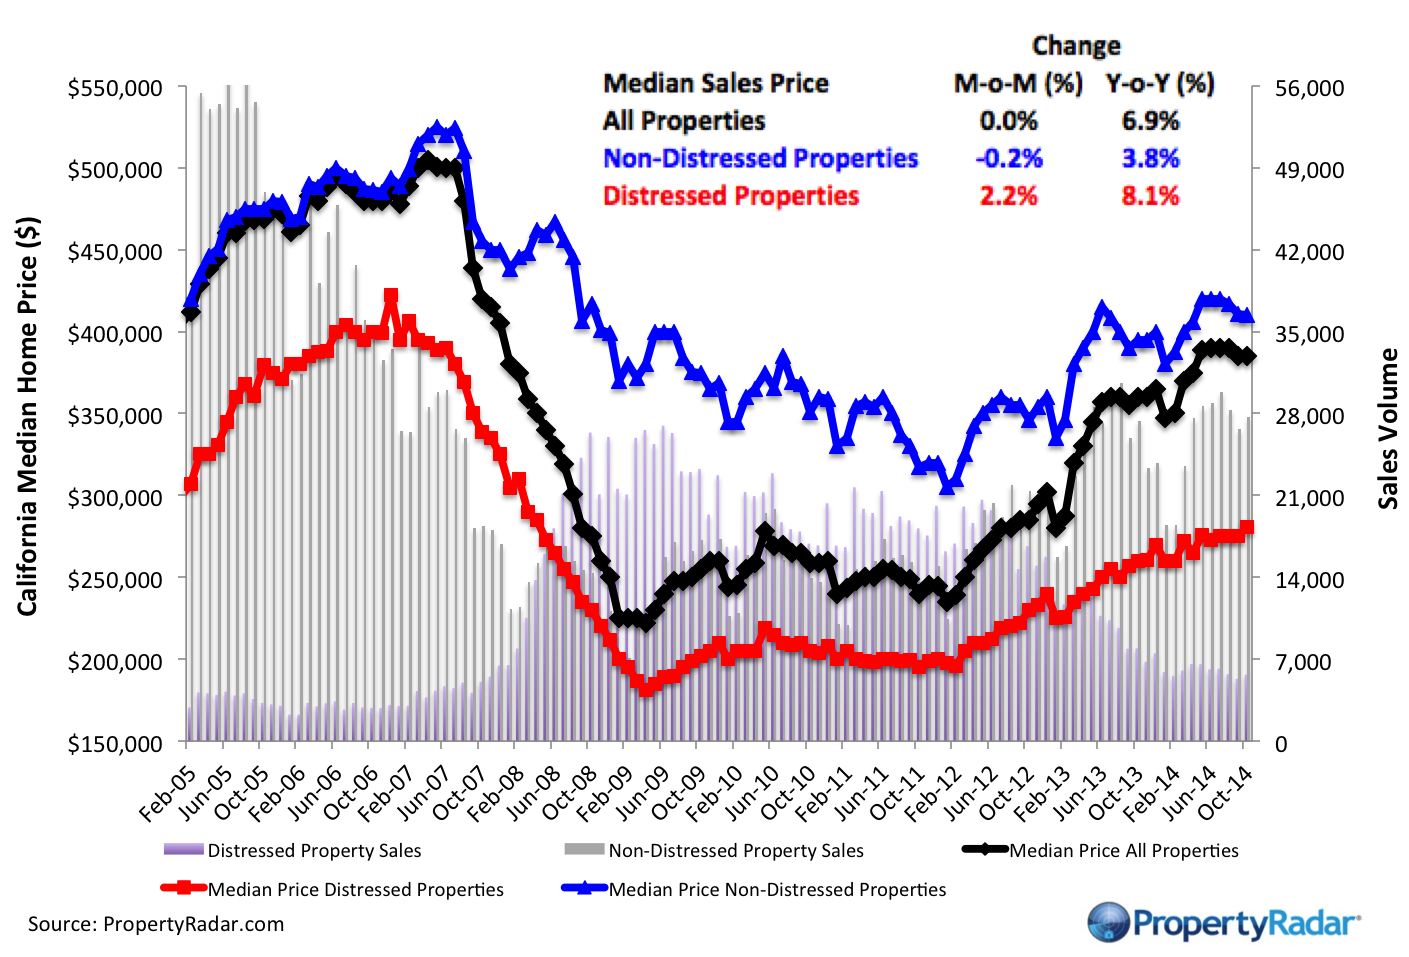
Median Sales Price vs. Sales Volume - Median sales price (left axis) of a California single-family home versus sales volume (right axis), by month from 2005 to current. Median sales prices are divided into three categories: All single-family homes (blue line), distressed properties (red line), and non-distressed properties (green line). Monthly sales volume (right axis) are illustrated as gray and lavender bars. The gray bars are distressed sales and the lavender bars are non-distressed sales.
California Homeowner Equity
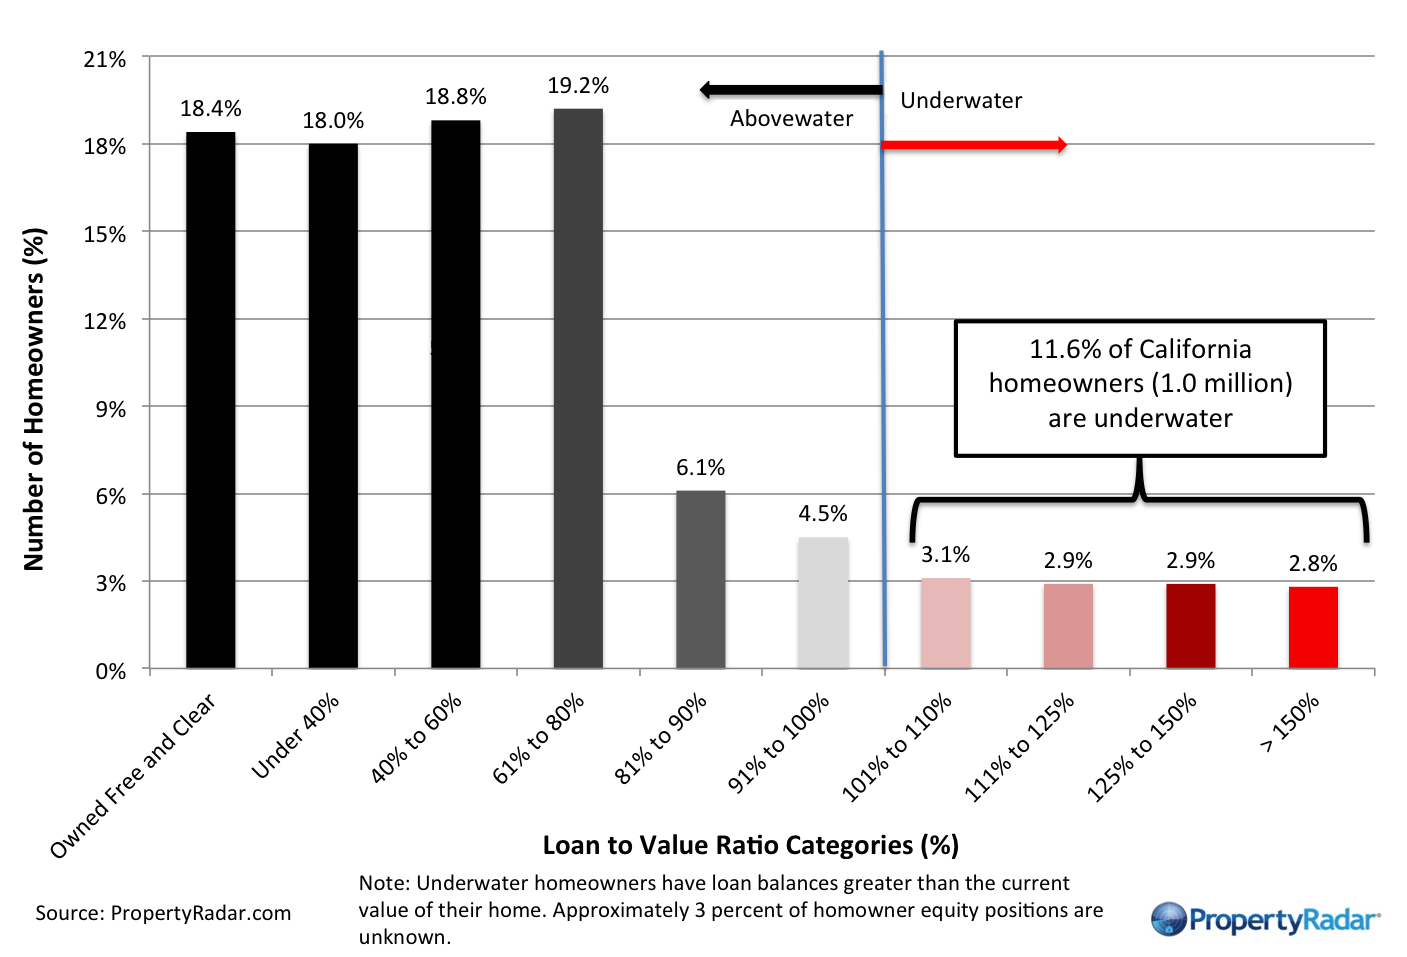
California Home Owner Equity - A model estimate of California homeowners segregated into various categories of levels of homeowner equity for a given month. Homeowner numbers represent a percentage of total California homeowners.
Cash Sales
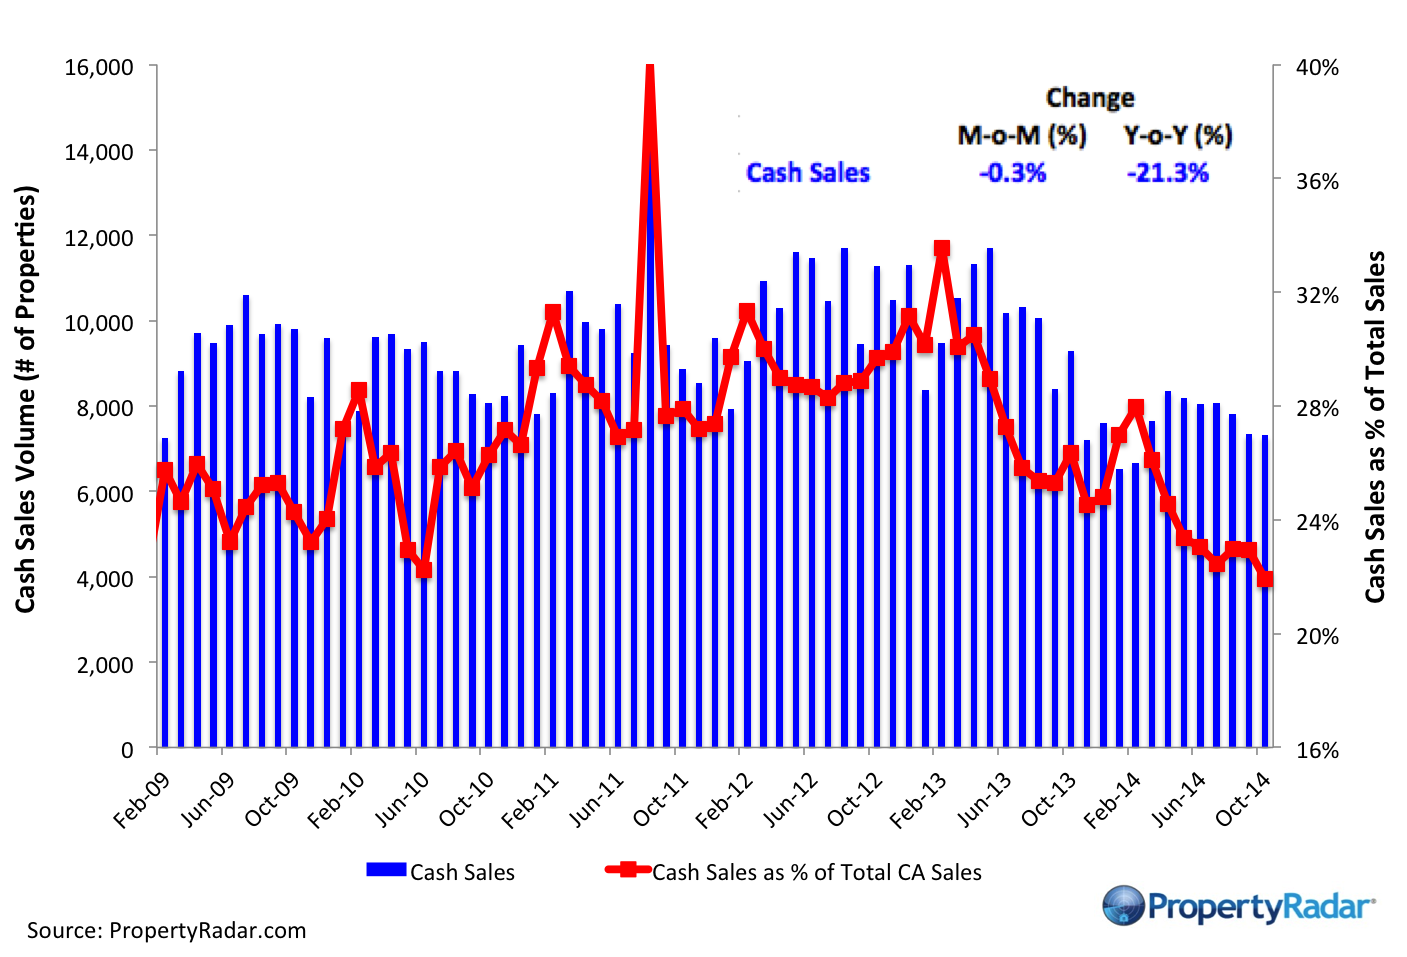
Cash Sales - The blue bars (right axis) illustrate cash sales of single-family residences and condominiums by month. The red line (left axis) illustrates cash sales as a percentage of total sales by month.
Flipping
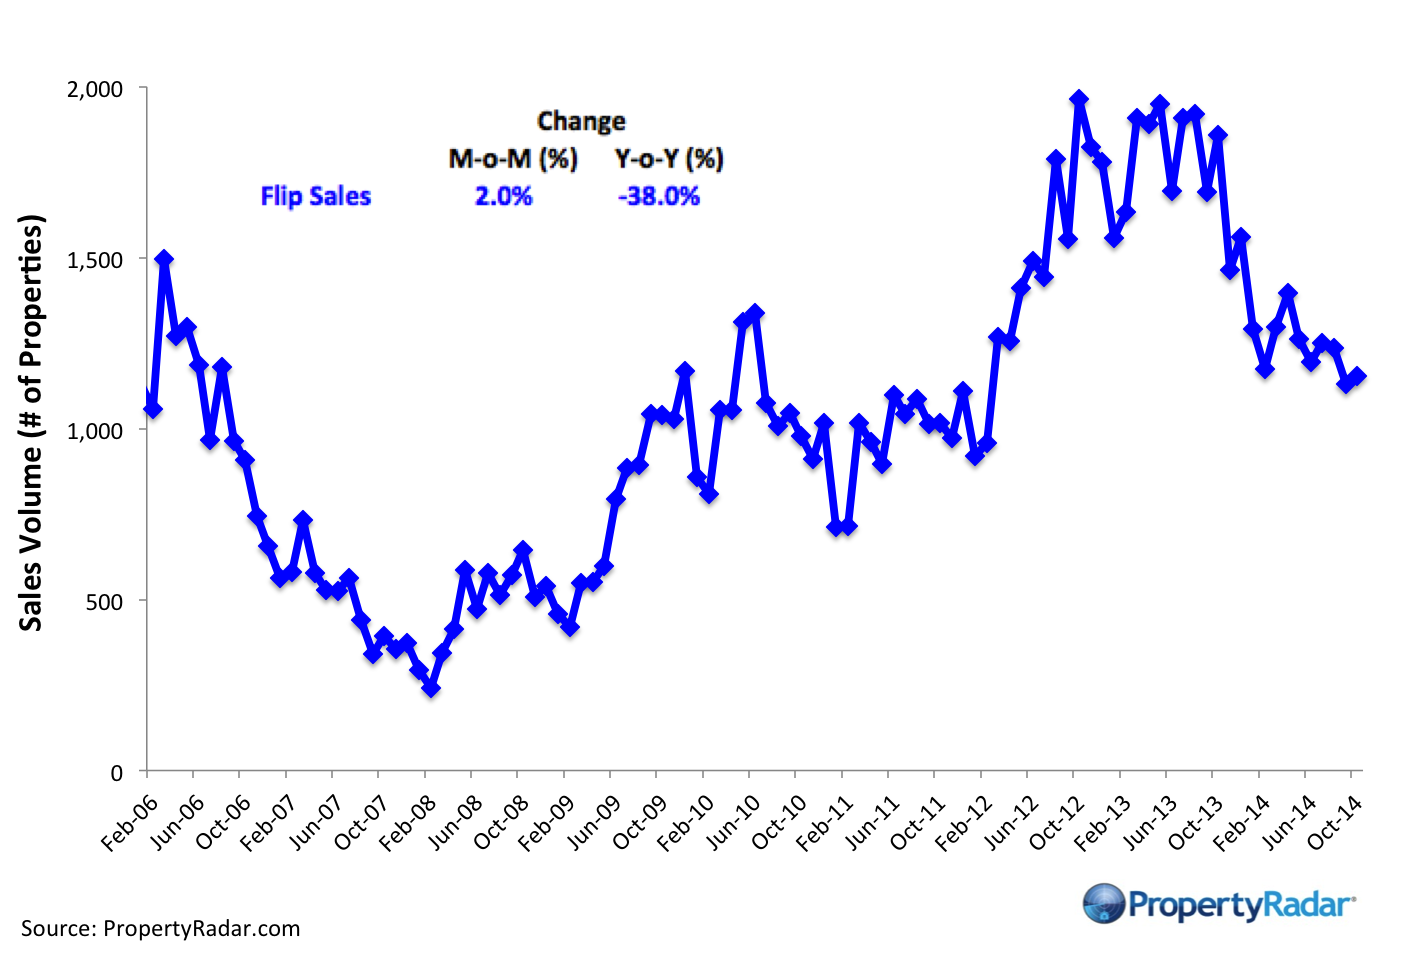
Flipping – The number of single-family residences and condominiums resold within six months.
Market Purchases by LLCs and LPs
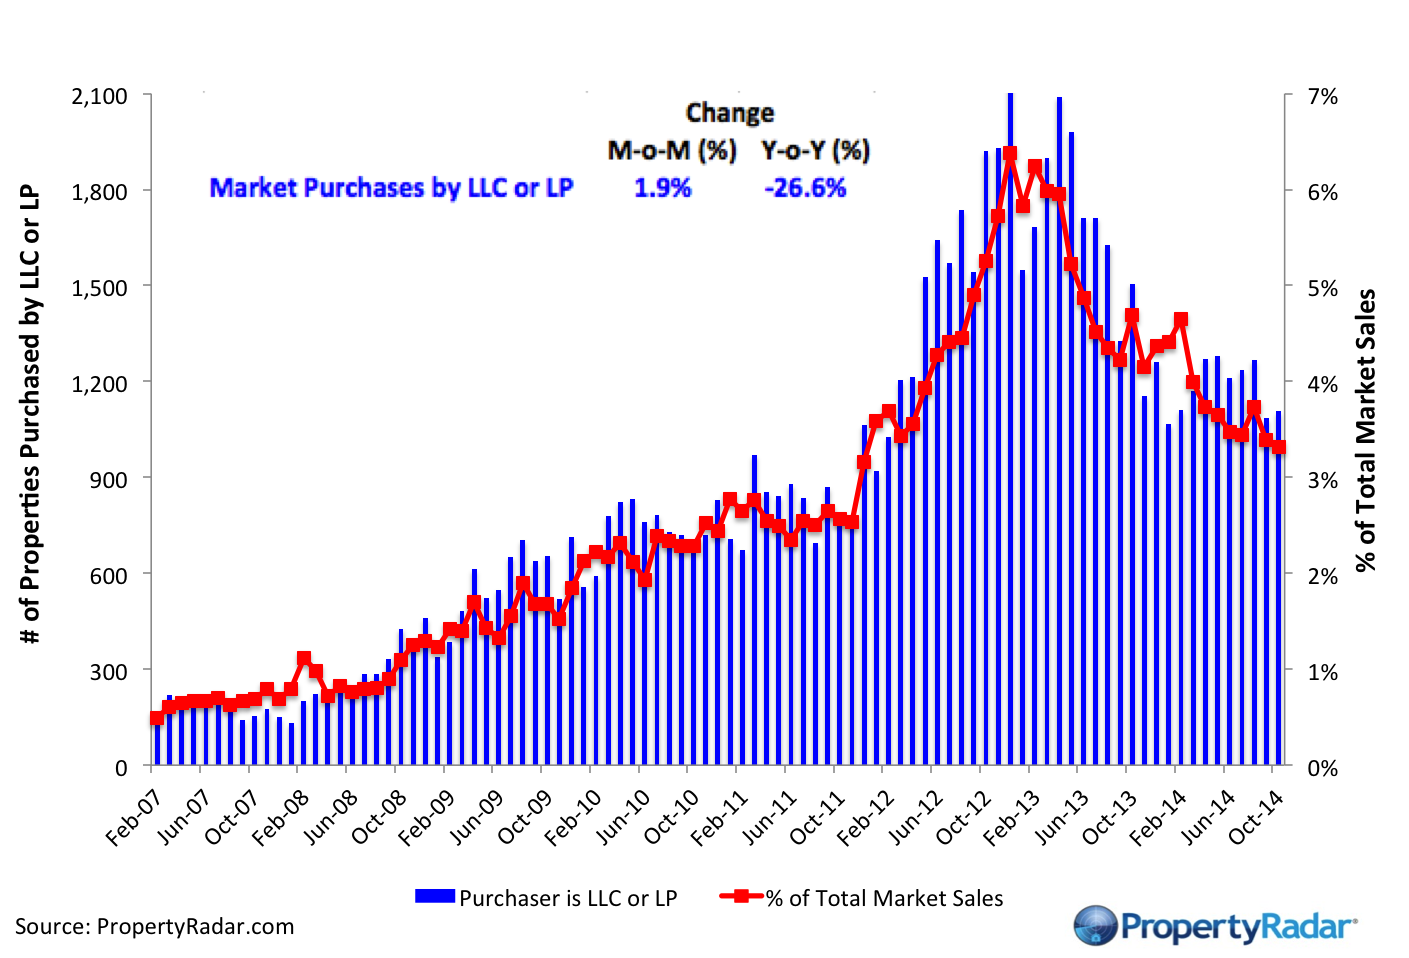
Market Purchases by LLCs and LPs - The blue bars (right axis) illustrate market purchases of single family residences and condominiums by LLCs and LPs from 2007 to current. The red line graph (left axis) illustrates LLC and LP purchases as a percentage of total sales by month.
Market Sales by LLCs and LPs
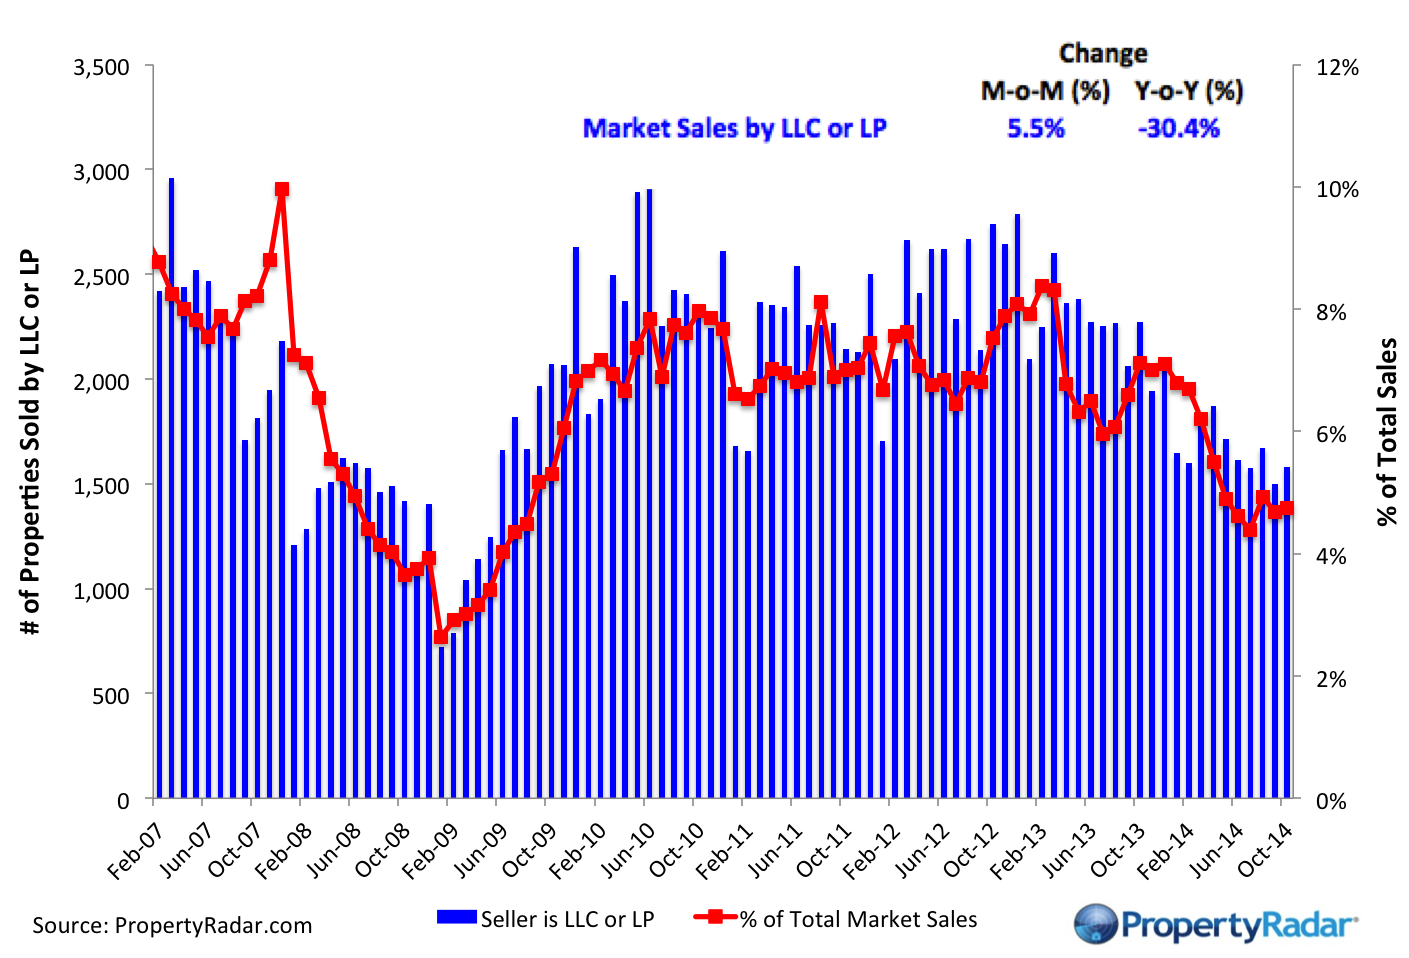
Market Sales by LLCs and LPs - The blue bars (right axis) illustrate market sales by LLCs and LPs of single-family residences and condominiums by month. The red line graph (left axis) illustrates sales as a percentage of total sales by month.
Trustee Sale Purchases by LLCs and LPs
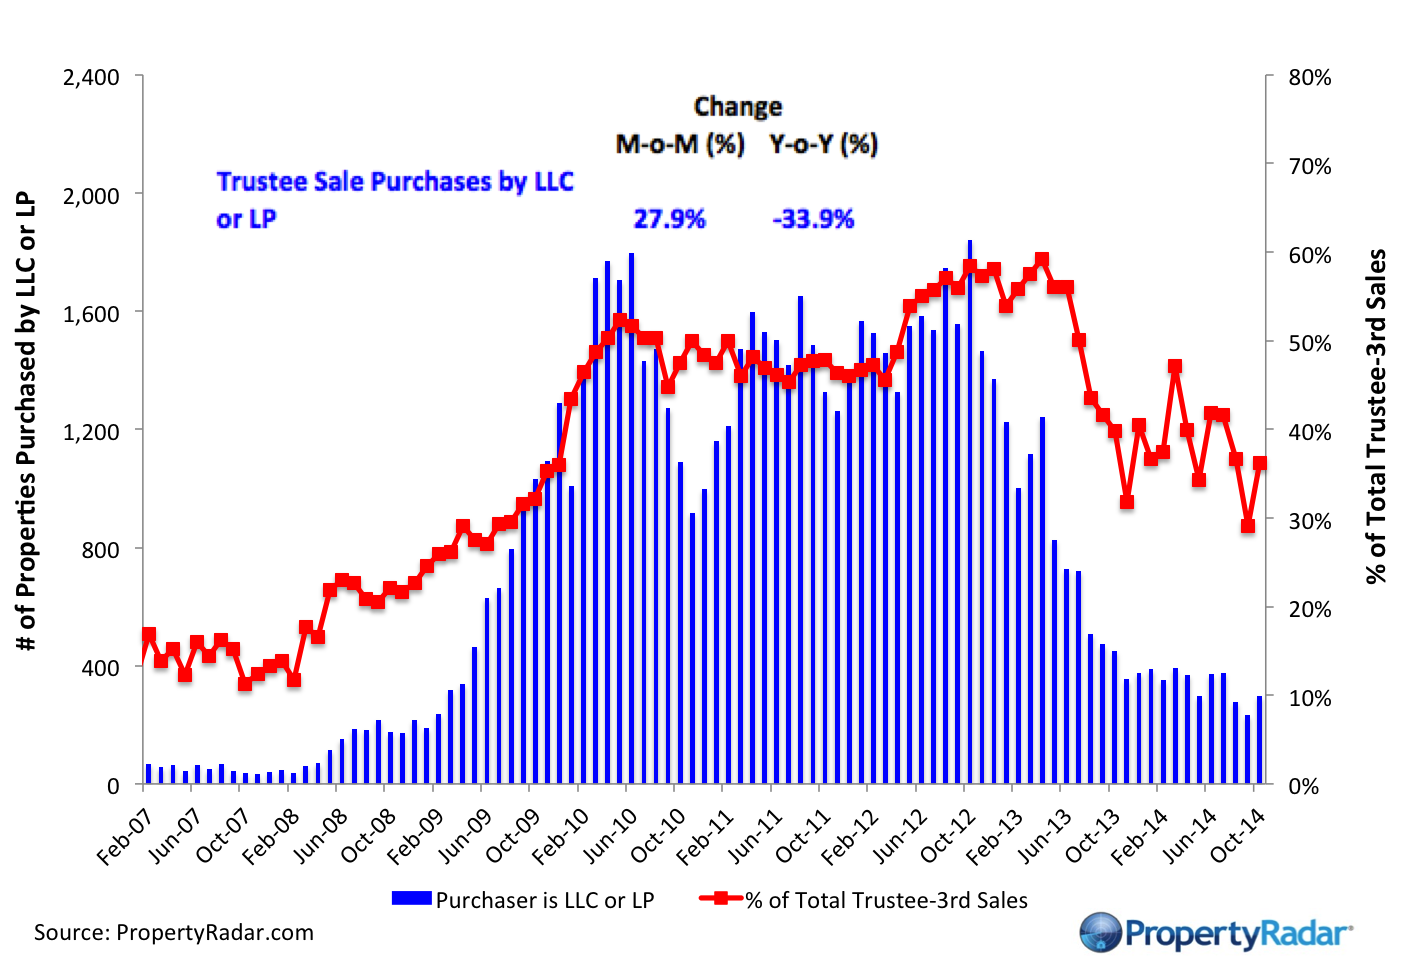
Trustee Sale Purchases by LLCs and LPs - The blue bars (right axis) illustrate trustee sale purchases (foreclosure sales) of single-family residences and condominiums by LLCs and LPs from 2007 to current. The red line graph (left axis) illustrates purchases as a percentage of total trustee sales by month.
Foreclosure Notices and Sales
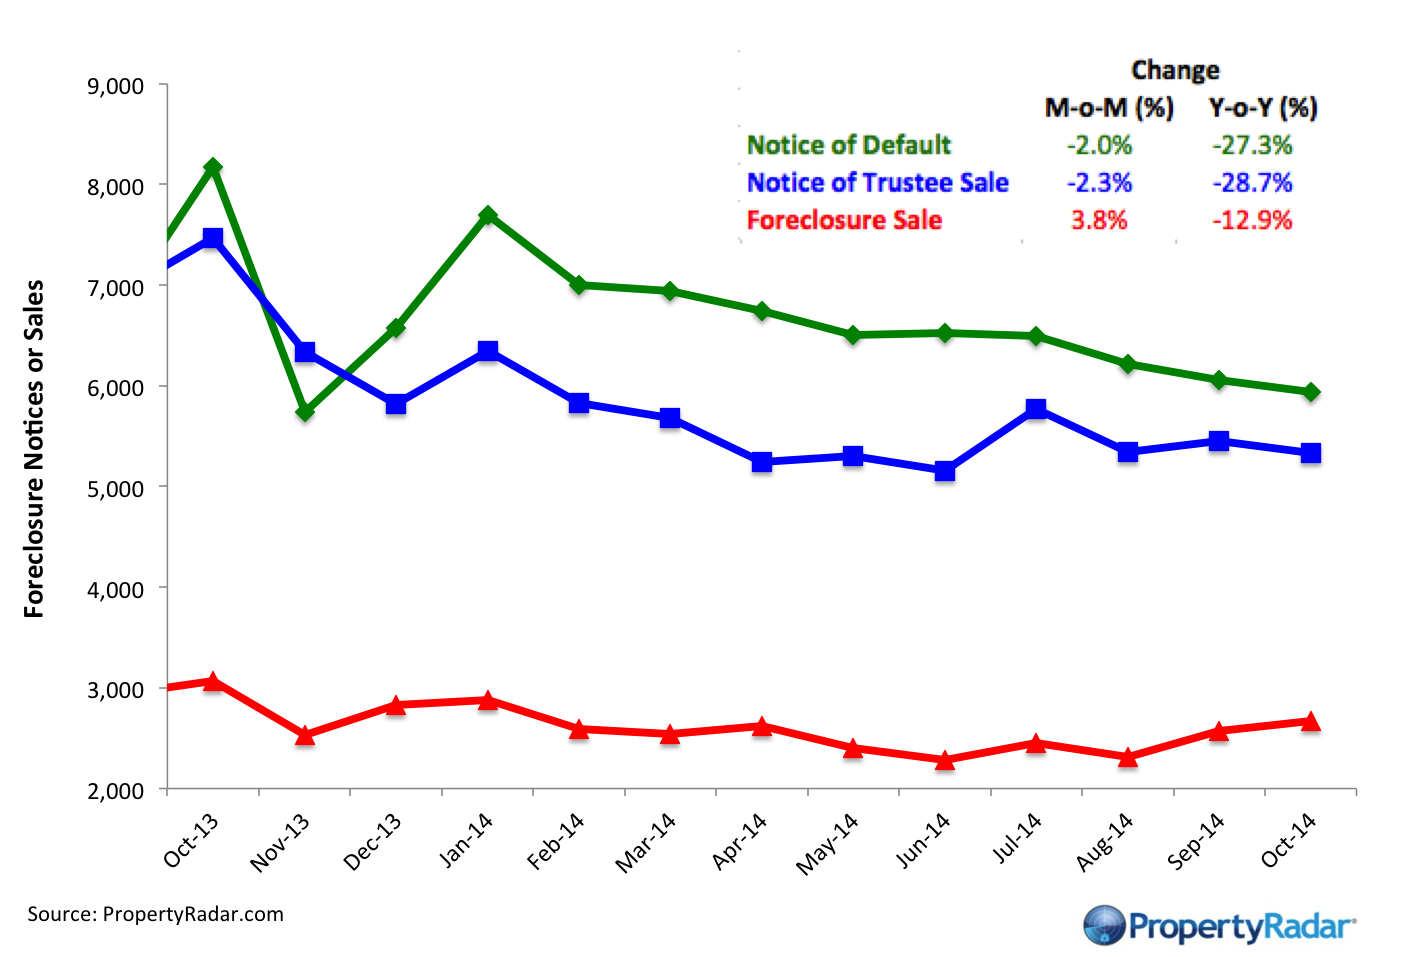
Foreclosure Notices and Sales - Properties that have received foreclosure notices — Notice of Default (green) or Notice of Trustee Sale (blue) — or have been sold at a foreclosure auction (red) by month.
Foreclosure Inventories
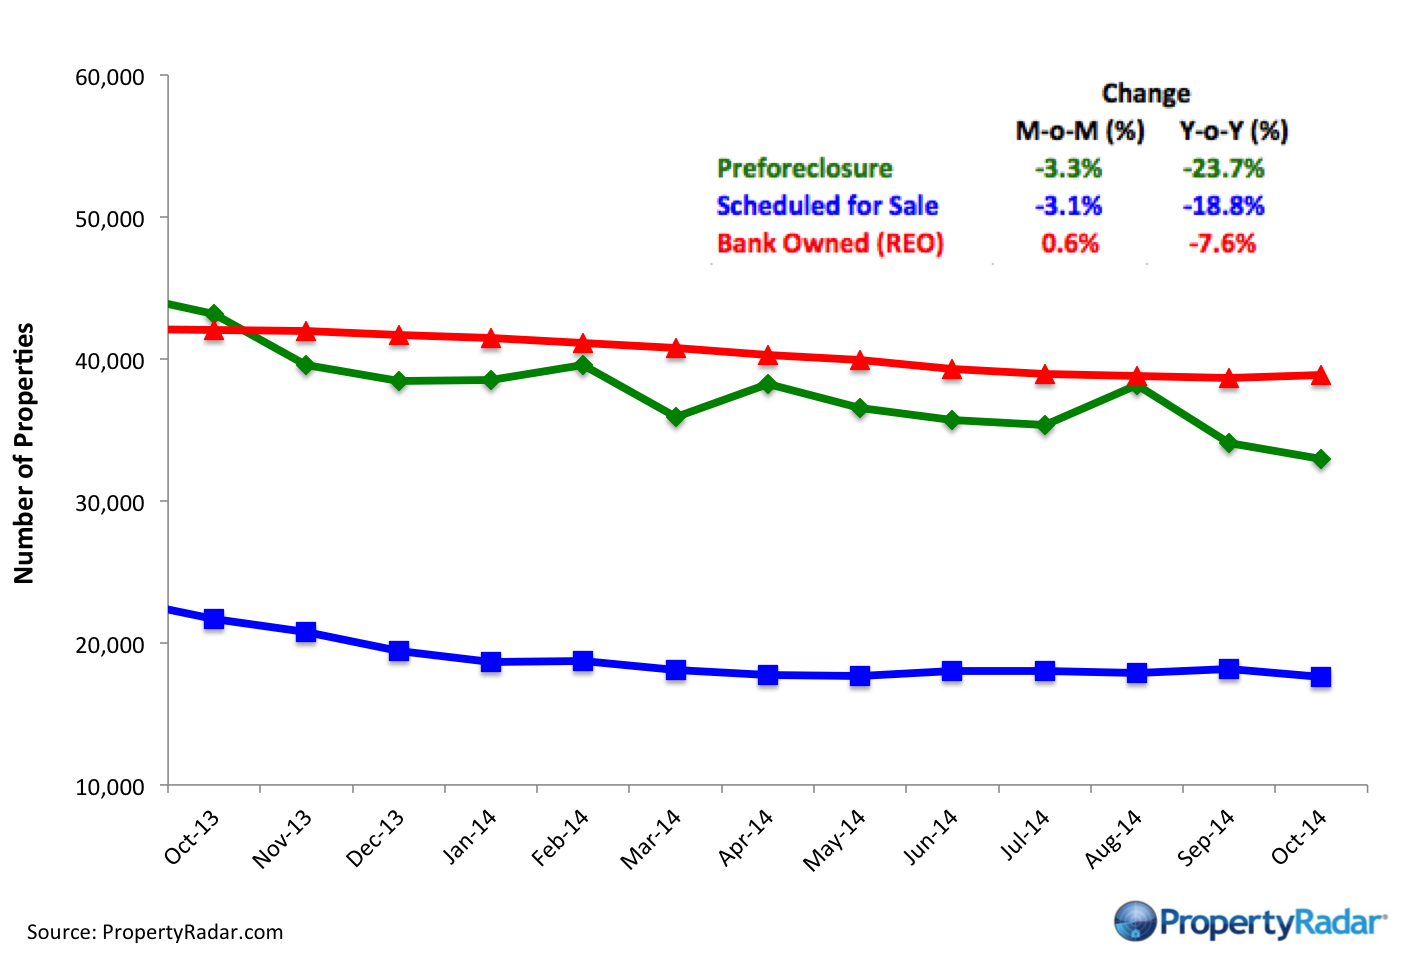
Foreclosure Inventory - Preforeclosure inventory estimates the number of properties that have had a Notice of Default filed against them but have not been Scheduled for Sale, by month. Scheduled for Sale inventory represents properties that have had a Notice of Trustee Sale filed but have not yet been sold or had the sale cancelled, by month. Bank-Owned (REO) inventory means properties sold Back to the Bank at the trustee sale and the bank has not resold to another party, by month.
Real Property Report Methodology
California real estate data presented by PropertyRadar, including analysis, charts, and graphs, is based upon public county records and daily trustee sale (foreclosure auction) results. Items are reported as of the date the event occurred or was recorded with the California county. If a county has not reported complete data by the publication date, we may estimate the missing data, though only if the missing data is believed to be 10 percent or less of all reported data.
