February Sales Up 3.3 Percent From January
Median Price Gains 1.6 Percent
February 2015 California single-family home and condominium sales were 23,404, up 3.3 percent from 22,659 in January, the largest February increase since 2012. On a year-over-year basis, sales were down 2.4 percent. Regionally, February sales were up 2.0 percent across the nine Bay Area counties, 4.7 percent in Southern California, and 9.5 percent in Central California.
“Home sales picked up in February,” said Madeline Schnapp, Director of Economic Research for PropertyRadar. “The acceleration is likely due to the mild winter weather but could also be a precursor of more robust sales this coming spring.”
The median price of a California home was 375,000 dollars in February, a gain of 6,000 dollars, or 1.6 percent, from 369,000 dollars in January. On a year-over-year basis prices were up 6.5 percent. For the month, median prices rose in 18 of the 26 largest California counties ranging from an increase of 1.7 percent in San Diego County to 16.7 percent in Contra Costa County.
“The increase in median prices in February usually points to higher prices in spring,” said Schnapp. “While the warm winter weather is the likely culprit, we can’t rule out other positive economic forces like robust job growth throughout 2014. Time will tell.”
Foreclosure activity declined in February. Despite the February decline, foreclosure activity has been trending sideways since November 2013. February Notices of Default totaled 5,800, down 4.5 percent from 6,075 in January. Foreclosure Sales totaled 1,868, down 15.9 percent from January.
“The low level of foreclosures is a good news, bad news story,” said Schnapp. “While the decline in foreclosures means the housing crisis is for the most part history, it also means lower priced inventory, attractive to both first-time home buyers and investors, is scarce.”
In other California housing news:
- Cash sales were 5,911 in February, up 4.1 percent from January and represented 25.6 percent of total sales. Cash sales should increase over the next few months mirroring the increase in overall sales. Over a longer period of time, cash sales have been steadily declining since reaching a peak of 40.0 percent of total sales in August 2011. Since then, cash sales are down nearly 58.0 percent.
- Flip sales total 772 in February, down 7.7 percent for the month and 32.7 percent for the year. Flip sales are defined as properties that have been resold within six months. Flip sales comprised 3.3 percent of total sales in February, down 0.4 percent from January. Flip sales peaked in May 2013 at 5.1 percent of total sales and have declined 60.0 percent since then.
- Institutional Investor LLC and LP purchases in February totaled 1,001, down 8.2 percent for the month and 10.4 percent from February 2014. Over the longer term, institutional investor demand has retreated due to the lower return on investment and dwindling supply of distressed properties for sale. Purchases are down 54.9 percent since peaking in December 2012. Similarly, Trustee Sale purchases by LLC and LPs are down 86.8 percent from their October 2012 peak.
- February Foreclosure starts, Notices of Default (NODs), were down 4.5 percent from January and down 17.2 percent in the past 12 months. Despite the February decline, Foreclosure Notices have been trending mostly sideways, indicative of a bottoming process, since November 2013. Foreclosure Sales fell 15.9 percent for the month and were down 27.9 percent in the past 12 months.
“The decline in cash and flip sales merely reflects the decline in institutional investor purchasing activity,” said Schnapp. “The rise in prices has put downward pressure on the return on investment thus reducing cash and flip sales.”
Home Sales
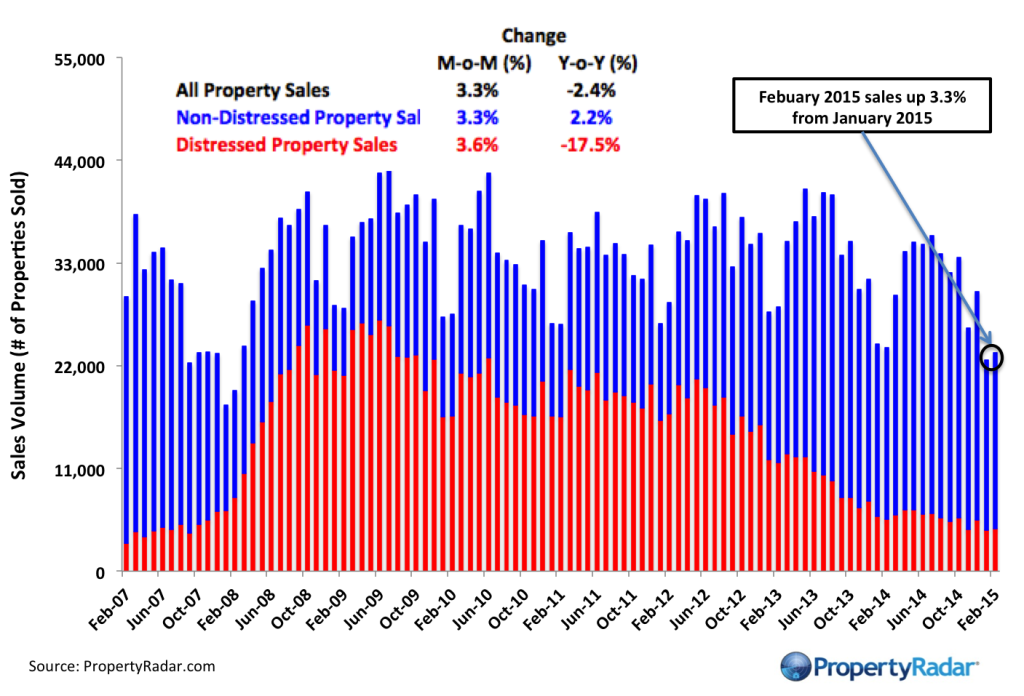
Home Sales – Single-family residence and condominium sales by month from 2007 to current divided into distressed and non-distressed sales. Distressed sales are the sum of short sales, where the home is sold for less than the amount owed, and REO sales, where banks resell homes that they took ownership of after foreclosure. All other sales are considered non-distressed.
Year-over-Year Home Sales
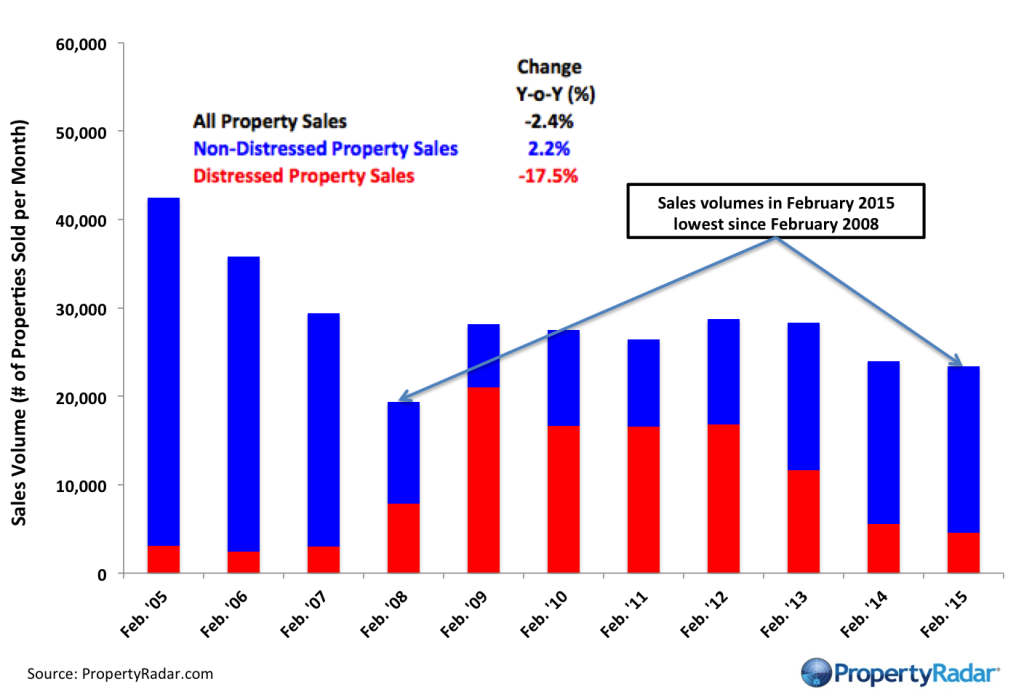
Year-over-Year Home Sales – Single-family residences and condominiums sold during the same month for the current year and prior years divided into distressed and non-distressed sales.
Median Sales Prices vs. Sales Volume
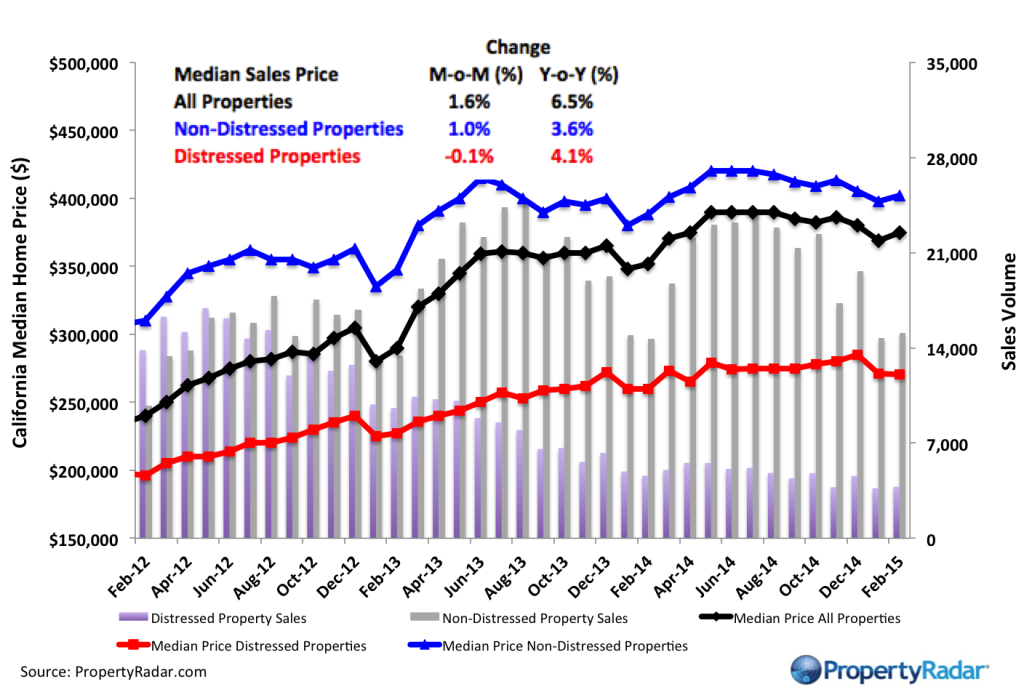
Median Sales Price vs. Sales Volume – Median sales price (left axis) of a California single family home versus sales volume (right axis), by month from 2005 to current. Median sales prices are divided into three categories: All single-family homes (blue line), distressed properties (red line), and non-distressed properties (green line). Monthly sales volume (right axis) are illustrated as gray and lavender bars. The gray bars are distressed sales and the lavender bars are non-distressed sales.
Cash Sales
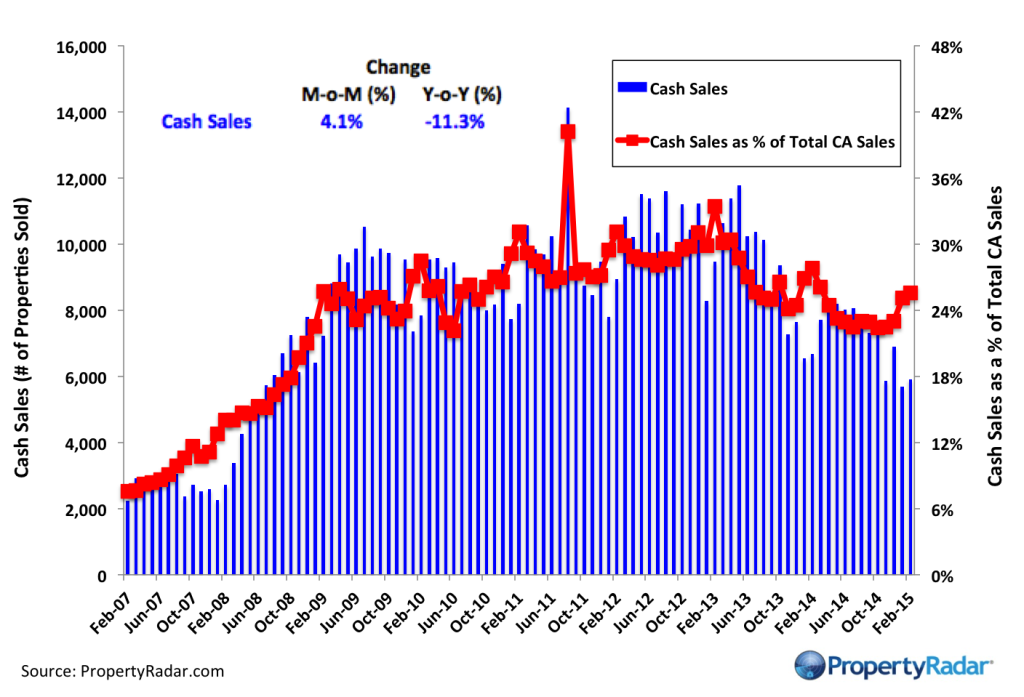
Cash Sales – The blue bars (right axis) illustrate cash sales of single-family residences and condominiums by month. The red line (left axis) illustrates cash sales as a percentage of total sales by month.
Flipping
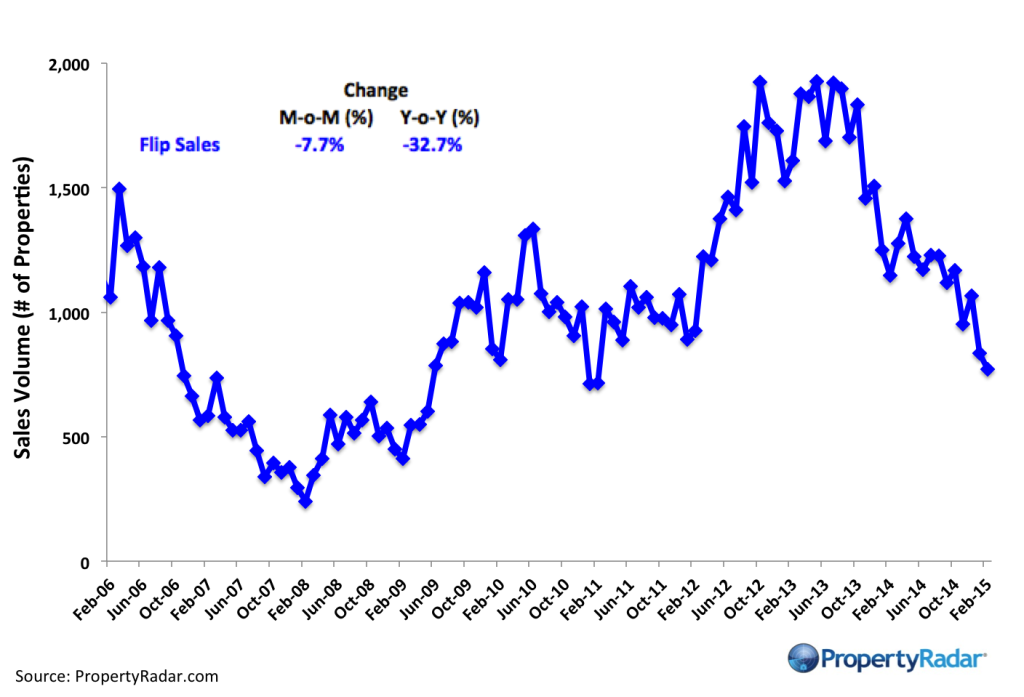
Flipping – The number of single-family residences and condominiums resold within six months.
Market Purchases by LLCs and LPs
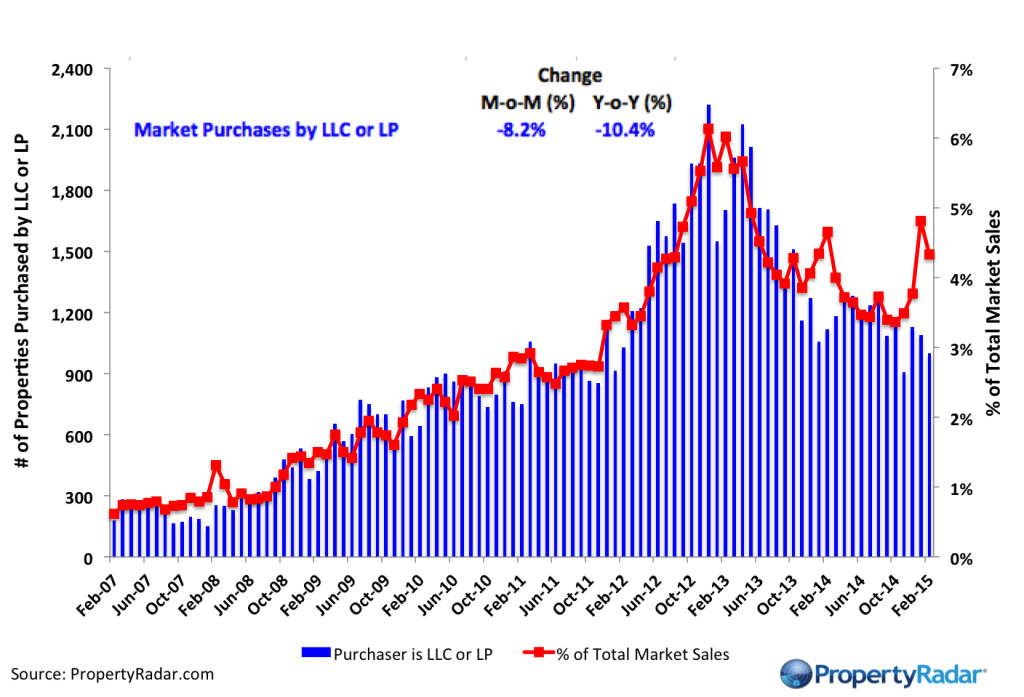
Market Purchases by LLCs and LPs – The blue bars (right axis) illustrate market purchases of single family residences and condominiums by LLCs and LPs from 2007 to current. The red line graph (left axis) illustrates LLC and LP purchases as a percentage of total sales by month.
Market Sales by LLCs and LPs
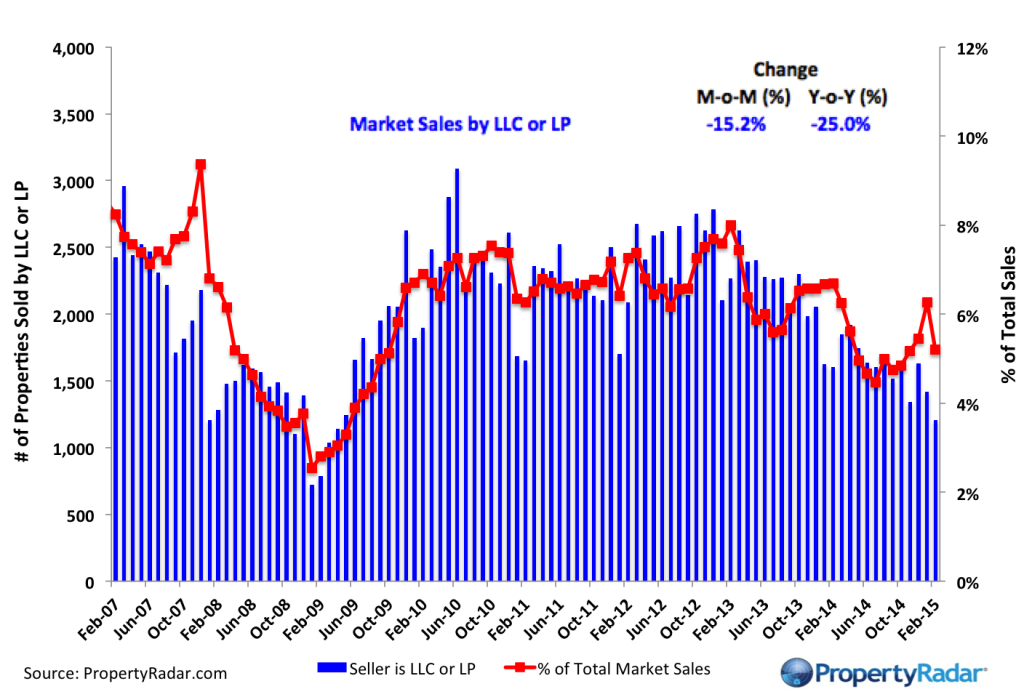
Market Sales by LLCs and LPs – The blue bars (right axis) illustrate market sales by LLCs and LPs of single-family residences and condominiums by month. The red line graph (left axis) illustrates sales as a percentage of total sales by month.
Trustee Sale Purchases by LLCs and LPs
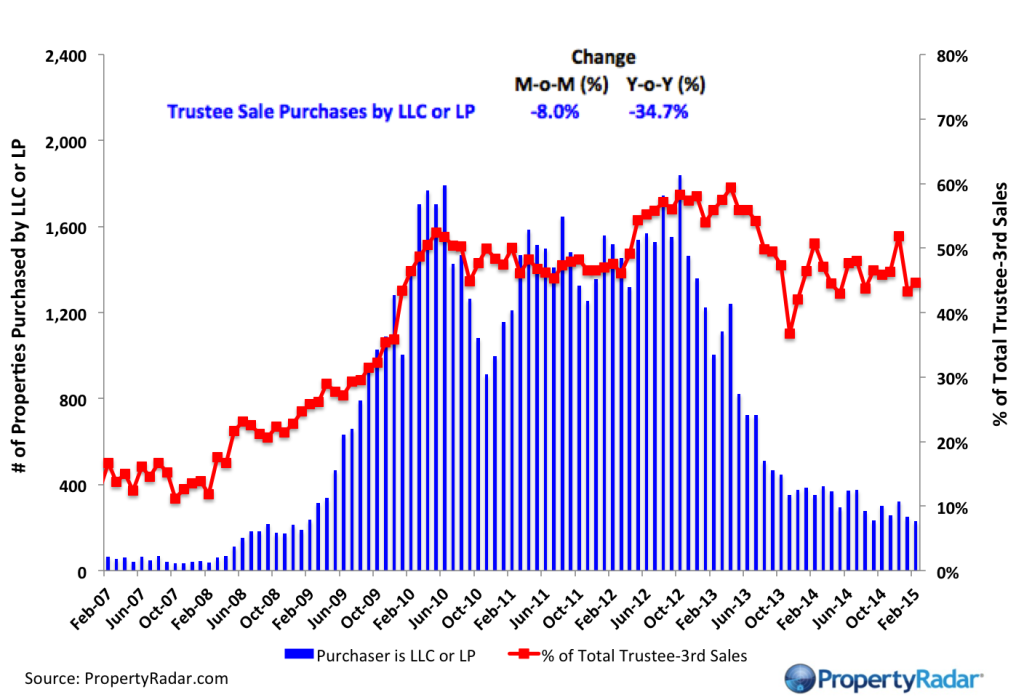
Trustee Sale Purchases by LLCs and LPs – The blue bars (right axis) illustrate trustee sale purchases (foreclosure sales) of single-family residences and condominiums by LLCs and LPs from 2007 to current. The red line graph (left axis) illustrates purchases as a percentage of total trustee sales by month.
Foreclosure Notices and Sales
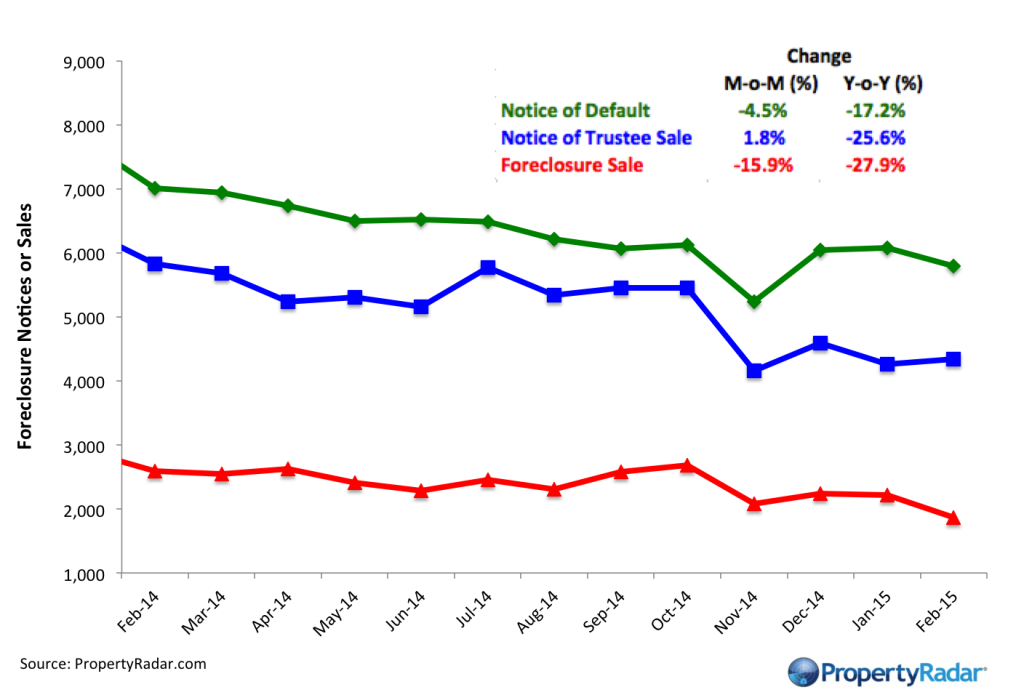
Foreclosure Notices and Sales – Properties that have received foreclosure notices — Notice of Default (green) or Notice of Trustee Sale (blue) — or have been sold at a foreclosure auction (red) by month.
Foreclosure Inventories
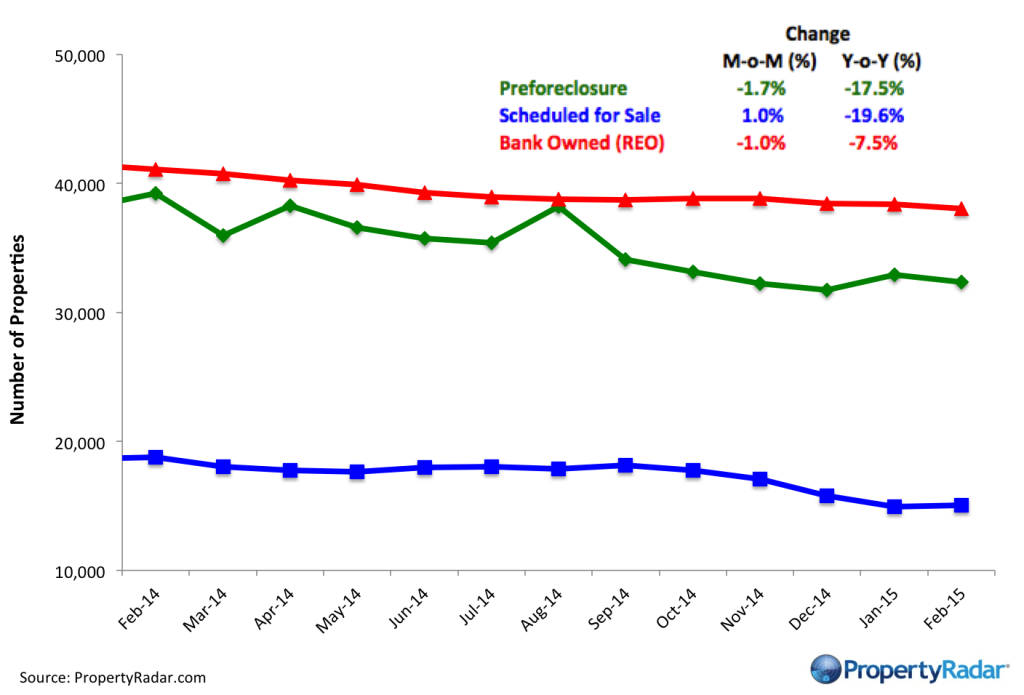
Foreclosure Inventory – Preforeclosure inventory estimates the number of properties that have had a Notice of Default filed against them but have not been Scheduled for Sale, by month. Scheduled for Sale inventory represents properties that have had a Notice of Trustee Sale filed but have not yet been sold or had the sale cancelled, by month. Bank-Owned (REO) inventory means properties sold Back to the Bank at the trustee sale and the bank has not resold to another party, by month.
Source: PropertyRadar
Real Property Report Methodology
California real estate data presented by PropertyRadar, including analysis, charts, and graphs, is based upon public county records and daily trustee sale (foreclosure auction) results. Items are reported as of the date the event occurred or was recorded with the California county. If a county has not reported complete data by the publication date, we may estimate the missing data, though only if the missing data is believed to be 10 percent or less of all reported data.


