Market Activity
California single-family home and condominium sales gained 1.4 percent in December from November, and were down 18.4 percent from a year ago.
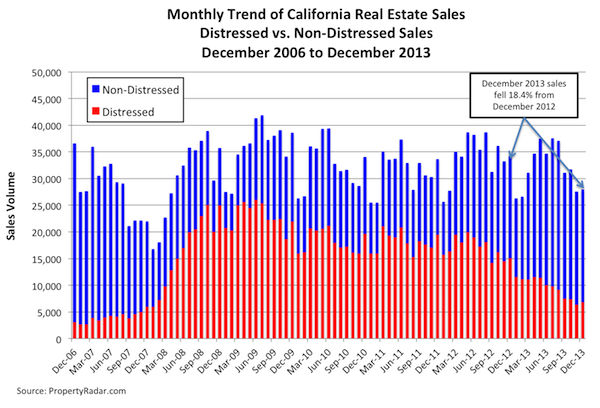
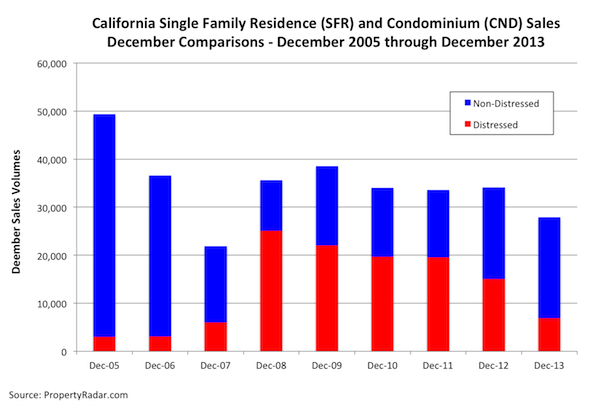
To get a clearer picture of current real estate sales trends and to eliminate seasonal factors, we compare December 2013 property sales to December sales in prior years. Dividing sales into their distressed and non-distressed components, non-distressed sales were up 10.3 percent, but a 54.5 percent decline in non-distressed property sales triggered an 18.4 percent decline in overall year-over-year sales.
Despite December’s sizeable year-over-year decline in distressed property sales, they still accounted for 24.6 percent of total sales, which remains historically high. More importantly, distressed property sales, as a percent of total sales, are much higher in counties away from the coastal areas. Of the 26 largest counties, the eight counties with the highest percentage of distressed property sales - Fresno, Kern, Merced, San Bernardino, San Joaquin, Solano, Stanislaus, and Tulare - are in non-coastal areas. In those counties, distressed property sales represented more than 30 percent of sales; Merced County was highest at 37.8 percent.
Homeowner Equity
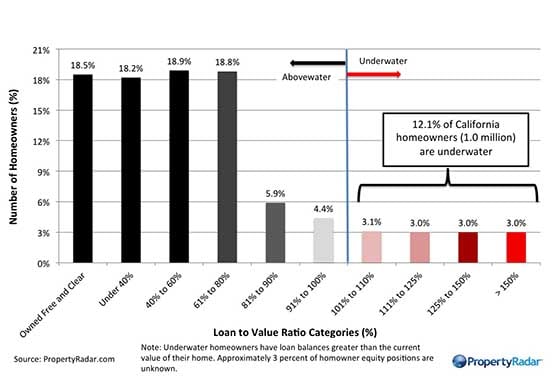
The steady rise in home prices since January 2012 has helped thousands of previously underwater homeowners in California shift to positive-equity status, so they can refinance or sell their homes. In December, the number of homeowners with more than 10 percent equity in their homes was nearly unchanged; in the past five months that number has increased by 4.1 percent, or approximately 200,000. Since August, the number of homeowners who are moderately to severely underwater has fallen by 12.8 percent, or approximately 160,000.
Despite the improvement, large numbers of underwater homeowners remain a drag on the California real estate market. In December, nearly 1.4 million (16 percent) of California’s 8.6 million homeowners were underwater while nearly 420,000 (4.8 percent) were barely above water (less than 10 percent equity in their homes). Since costs to resell a home are as much as 10 percent of a home’s sale price, these homeowners are effectively underwater. All told, 20.8 percent of homeowners (approximately 1.8 million) are underwater or barely above water and effectively shut out of the California real estate market.
Several of California’s largest counties continue to struggle with much higher levels of negative equity. In Fresno, Kern, Merced, San Bernardino, San Joaquin, Solano, Stanislaus, and Tulare counties, 25 to 31 percent of homeowners are moderately to severely underwater.
Median Prices
In December, the median sale price of a California home gained $5,000, or 1.4%, to $365,000 from $360,000 in November. Median prices have hovered near $360,000 since June. Rapid monthly home price increases, that typified the California real estate market in 2012 and the first half of 2013, appear to have slowed or reversed course in response to a 115-basis-point increase in mortgage interest rates since May. On a year-over-year basis, median prices increased 21.7 percent from $300,000 to $365,000.
Changes in the mix of distressed and non-distressed property sales from 2012 to 2013 continue to influence the year-over-year change in median prices. Distressed property sales decreased from 44.2 percent of total sales in December 2012 to 24.6 percent in December 2013. The median price of a distressed California home increased 12.5 percent year-over-year from $240,000 in December 2012 to $270,000 in December 2013. Meanwhile, the median price of a non-distressed home increased 9.6 percent year-over-year, from $365,000 to $400,000.
The following graph highlights median sales price trends from December 2004 to December 2013. Aggregate single-family home median sales prices are shown in blue, and distressed and non-distressed median prices are shown in red and green, respectively.
Cash Sales
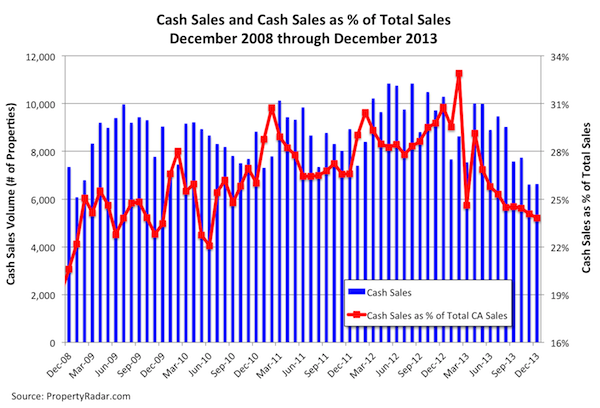
In December 2013, cash sales represented 23.8 percent of total sales, down 0.3 percentage points from 24.1 percent in November. Taking a longer-term view, cash sales as a percent of sales oscillated between 28 percent and 31 percent from January 2012 through January 2013. They peaked at 33.0 percent in February 2013 and have been below 25 percent since August 2013. Despite recent declines, from a historic perspective, cash sales remain high and are an important part of the real estate marketplace.
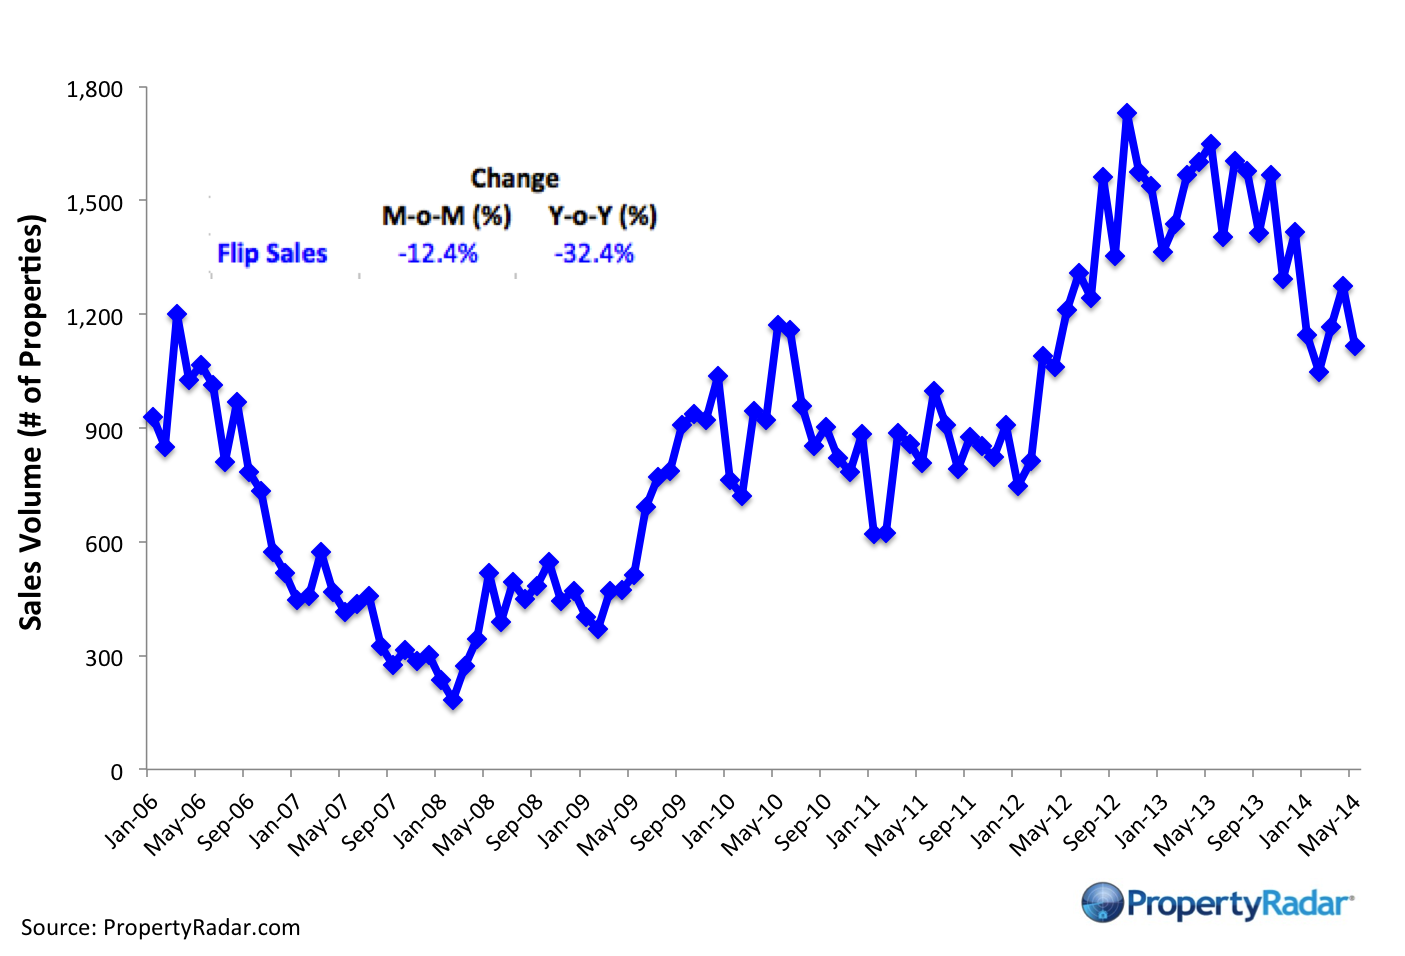
Flipping
December 2013 flipping (reselling a property within six months) gained 9.2 percent, recovering some of November’s 17.9 percent decline. Despite the December gain, flipping was down 6.7 percent from a year ago. Flips represented 5.1 percent of total sales in December, up from 4.8 percent in November.
Taking a longer-term view, in 2011, as housing prices trended sideways, flipping was basically flat, ranging from 2.5 percent of sales in January to 2.7 percent in December 2011. In 2012, flipping as a percent of sales began to increase, rising from 2.9 percent in January 2012 and peaking in February 2013 at 5.5 percent. Flipping retreated from February 2013 to June 2013, reaching an interim bottom of 4.1 percent of sales.
In December, within the 26 largest California counties, flipping as a percent of sales was greatest in Los Angeles, Merced, Orange, Riverside, Sacramento, San Bernardino, Stanislaus, and Tulare counties; Orange County was the highest at 7.9 percent of sales.
Investor (LLC and LP) Purchases
Investors organized as a limited liability corporation (LLC) or a limited partnership (LP) have played an increasingly important role in the California property market over the past five years. LLC and LP California property purchases take the form of either a market purchase or a third party purchase at a trustee sale. Trends in these two purchase categories yield important information about the California property market.
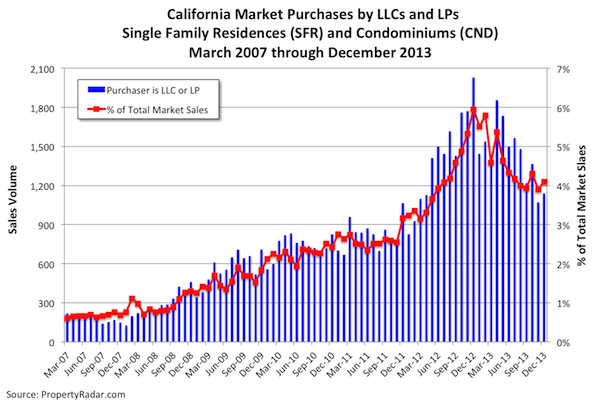
Market Purchases by LLCs and LPs
Market purchases by LLCs and LPs posted steady gains from 2008 through 2011, accelerating rapidly in 2012 and reaching a peak in December 2012. Since then, LLC and LP market purchases have been trending lower and are now 48.3 percent below their December 2012 peak. Despite the longer-term decline, December 2013 purchases gained 6.5 percent, reversing some of November’s 21.6 percent decline.
Trustee Sale Purchases by LLCs and LPs
Trustee sale purchases by LLCs and LPs also posted steady gains throughout 2008 and 2009 and reached an interim peak in March 2010 before retreating in response to myriad government programs designed to delay foreclosures. From March 2010 to October 2012, trustee sale purchases by LLCs and LPs remained elevated and reached a new peak in October 2012. Since then, third-party LLC and LP purchases have also been trending lower and are 80.3 percent below the peak. December 2013 trustee sale purchases gained 2.5 percent for the month but are down 73.6 percent from a year ago.
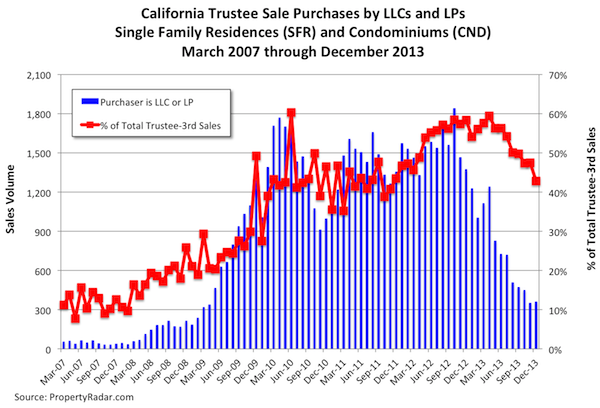
The steady decline in LLC and LP market and trustee sale purchases is being driven primarily by the increase in purchase prices. As prices rise, the potential return on investment (ROI) for holding properties as rentals decreases, making homes less attractive to investors.
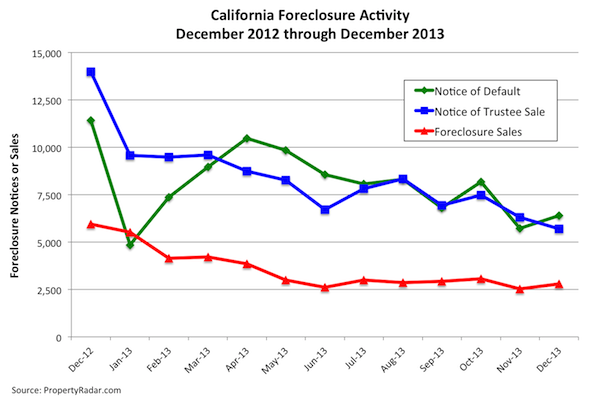
Foreclosures
December California foreclosures - Notices of Default, Notices of Trustee Sale, and Foreclosure Sales - remain near their lowest levels in our records dating to January 2007.
California Notices of Default gained 11.9 percent in December, recovering some of November’s 32.0 percent decline. Despite December’s gain, Notices of Default are down 44.0 percent in the past 12 months. Notices of Trustee Sale fell 9.9 percent in December and are down 59.3 percent for the year. Foreclosure sales gained 10.4 percent for the month but fell 53.5 percent for the year.
Madeline’s Take - Director of Economic Research, PropertyRadar
For the fifth consecutive month, December 2013 California property sales declined on a year-over-year basis, confirming that the 115-basis-point increase in mortgage interest rates since May has been a drag on the California real estate market. In addition, the double-digit monthly increases in median home prices that occurred in 2012 and the first half of 2013 came to an abrupt stop in June 2013 and median prices have been more or less unchanged ever since. The slowdown in price appreciation is good news for homebuyers who found themselves priced out of the market earlier last year.
Now that the Federal Reserve has begun to unwind their QE3 bond-buying program, in 2014 we expect 30-year mortgage interest rates to gradually rise from their current 4.5 percent level to 5.0 percent sometime later this year. While some believe that the rise in mortgage interest rates will have little effect on the California property market, I believe the sluggish pace of income and job growth, hallmarks of the current recovery, will continue to weigh down the real estate markets which will likely see slower growth and price appreciation.
Sean’s Take - Founder/CEO, PropertyRadar
With the start of the New Year comes the time for predictions. With the recent rapid price increases, slow down in sales, rising rates, and increasing inventories, I'm predicting that the median price in California will remain relatively flat in 2014, perhaps plus or minus 5 percent. There are certainly many others who are predicting significant increases of 8 percent, 10 percent, or more. They cite that both interest rates and inventories remain historically low. I've even heard some say that prices always rise when inventories are low. How quickly we forget that inventories were also historically low in 2006. That didn't work out so well. Don't worry, I think prices are far more sustainable today than in 2006. And to that point, I admit that my prediction is more of a hope. I think stable prices this year would be very healthy for the market. A 10 percent increase would put us back into bubble territory without question unless that rise was accompanied by higher wages, which I just don't see happening. Similarly, a big decrease would be a disaster. Flat is boring, but after the recent roller coaster, maybe it's time to catch our breath.
Real Property Report Methodology
California real estate data presented by PropertyRadar, including analysis, charts, and graphs, is based upon public county records and daily trustee sale (foreclosure auction) results. Items are reported as of the date the event occurred or was recorded with the California county. If a county has not reported complete data by the publication date, we may estimate the missing data, though only if the missing data is believed to be 10 percent or less of all reported data.
