Discovery Bay, CA, August 12, 2010 - PropertyRadar (www.propertyradar.com), the only website that tracks every California foreclosure and provides daily auction updates, issued its monthly California Foreclosure Report for July 2010. Foreclosure activity was again mixed in July. Foreclosure filings and cancellations dropped after rising last month, while foreclosure sales rose after dropping last month."
Despite a tsunami of mortgage delinquencies we continue to see no signs of a foreclosure wave" says Sean O'Toole, Founder, and CEO of ForeclosureRadar.com. "Lenders and government intervention continue to delay foreclosures despite their continued failure to find a long term solution to unsustainable negative equity."
The discount from the market value at which 3rd Parties, typically investors, we're able to purchase properties at the trustee sale, varied by county. Orange County saw the toughest competition on the courthouse steps, with discounts from the market value of just 15.3 percent. Kern and Fresno Counties offered the largest discounts at 29.3 and 29.9 percent respectively. Statewide the average was 21.6 percent. Most investors resell properties they purchase at a trustee sale and must contend with the current occupant, past-due property taxes, senior liens, repairs, and resale expenses including commissions.
Foreclosure Filings
Notice of Default
Prior Month
-4.82%
Prior Year
-47.09%
Notice of Trustee Sale
Prior Month
-18.91%
Prior Year
-30.354%
Notice of Default filings is the first step in the foreclosure process. Notice of Trustee Sale filings set the date and time of auction and serve as the homeowner's final notice before the sale.
Month
Notice of Default
Notice of Trustee Sale
Feb-09
49799
21147
Mar-09
58623
34559
Apr-09
47737
31556
May-09
42203
43355
Jun-09
47093
30711
Jul-09
47530
40757
Aug-09
37063
34224
Sep-09
38175
33112
Oct-09
36534
38558
Nov-09
30478
28170
Dec-09
27200
28475
Jan-10
25904
27220
Feb-10
31309
28501
Mar-10
33139
34071
Apr-10
28901
31599
May-10
24167
28103
Jun-10
26421
34913
Jul-10
25148
28310
Foreclosure Outcomes
Cancellations
Prior Month
-13.75%
Prior Year
75.10%
Back to Bank (REO)
Prior Month
13.46%
Prior Year
-18.44%
Sold to 3rd Party
Prior Month
16.72%
Prior Year
29.43%
After the filing of a Notice of Trustee Sale, there are only three possible outcomes. First, the sale can be Cancelled for reasons that include a successful loan modification or short sale, a filing error, or a legal requirement to re-file the notice after extended postponements. Alternatively, if the property is taken to sale, the Bank will place the opening bid. If a 3rd party, typically an investor, bids more than the bank's opening bid, the property will be Sold to 3rd Party; if not, it will go back to the Bank and become part of that bank's REO inventory.
Month
Cancellations
Back to Bank (REO)
Sold to 3rd Party
Feb-09
6904
16419
1266
Mar-09
6352
9201
1094
Apr-09
6707
12145
1653
May-09
7162
15864
2305
Jun-09
8674
19713
2694
Jul-09
10818
14632
2691
Aug-09
10004
14367
3285
Sep-09
8660
13155
3411
Oct-09
8757
16018
3960
Nov-09
10487
14165
3683
Dec-09
13287
12471
2629
Jan-10
13859
13943
3707
Feb-10
13806
11983
3631
Mar-10
16520
15365
4031
Apr-10
18437
14615
4336
May-10
17280
13775
4044
Jun-10
21962
10518
2984
Jul-10
18942
11934
3483
Foreclosure Inventories
Preforeclosure
Prior Month
-20.18%
Prior Year
-28.56%
Scheduled for Sale
Prior Month
-4.12%
Prior Year
0.55%
Bank Owned (REO)
Prior Month
-1.05%
Prior Year
-18.63%
Preforeclosure inventory is an estimate of the number of properties that have had a Notice of Default filed against the property but have not yet been Scheduled for Sale. The Scheduled for Sale inventory indicates those properties that have had a Notice of Trustee Sale filed, but have not yet been sold or had the sale canceled. The Bank Owned (REO) inventory indicates the number of properties that have been sold Back to the Bank at the trustee sale, and which the bank has not yet resold to another party.
Date
Preforeclosure
Scheduled for Sale
Bank Owned (REO)
Feb-09
159215
64177
135488
Mar-09
179412
82390
122901
Apr-09
185603
92002
112792
May-09
174243
111824
107762
Jun-09
186060
113141
106139
Jul-09
175283
124874
100206
Aug-09
171841
131300
98829
Sep-09
169860
140382
95479
Oct-09
154905
149456
93926
Nov-09
157288
151573
93595
Dec-09
146941
147570
89119
Jan-10
152322
145977
90551
Feb-10
140126
145260
89529
Mar-10
157768
141669
89043
Apr-10
152770
137741
88490
May-10
144105
132269
87452
Jun-10
156874
130953
82402
Jul-10
125223
125559
81536
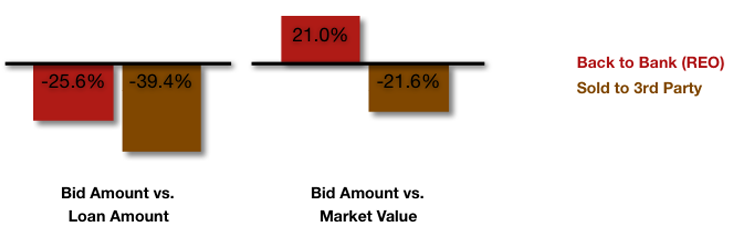
Foreclosure Discounting
Foreclosure discounting compares the winning Bid Amount of properties sold at a trustee sale to both the outstanding Loan Amount, and the current Market Value. Banks place an opening bid for each property, and if a 3rd Party does not make a higher bid the property will be sold Back to Bank (REO) for the opening bid amount. While 3rd Party bids are higher than the opening bid, properties Sold to 3rd Parties typically have lower opening bids to start with and therefore deeper discounts to both Loan Amount and Market Value.
Foreclosure Timeframes
Time to Foreclosure
Prior Month
-3.42%
Prior Year
20.56%
Time to Resell - Bank
Prior Month
0.75%
Prior Year
13.03%
Time to Resell - 3rd
Prior Month
-3.53%
Prior Year
12.33%
Time to Foreclose is the total time from the filing of the Notice of Default to the sale of the property at the trustee sale and reflects those properties sold in the month indicated. Time to Resell reflects how long it takes banks and 3rd parties to resell the properties they take back or purchase at trustee sale.
Date
Time to Forclose
Time to Resell- Bank
Time to Resell - 3rd
Feb-09
198
223
186
Mar-09
176
231
214
Apr-09
171
234
196
May-09
180
240
183
Jun-09
173
244
168
Jul-09
187
238
146
Aug-09
185
228
147
Sep-09
191
220
141
Oct-09
195
219
131
Nov-09
198
220
133
Dec-09
222
224
141
Jan-10
229
224
149
Feb-10
224
224
150
Mar-10
225
232
153
Apr-10
239
247
162
May-10
235
252
163
Jun-10
234
267
170
Jul-10
226
269
164
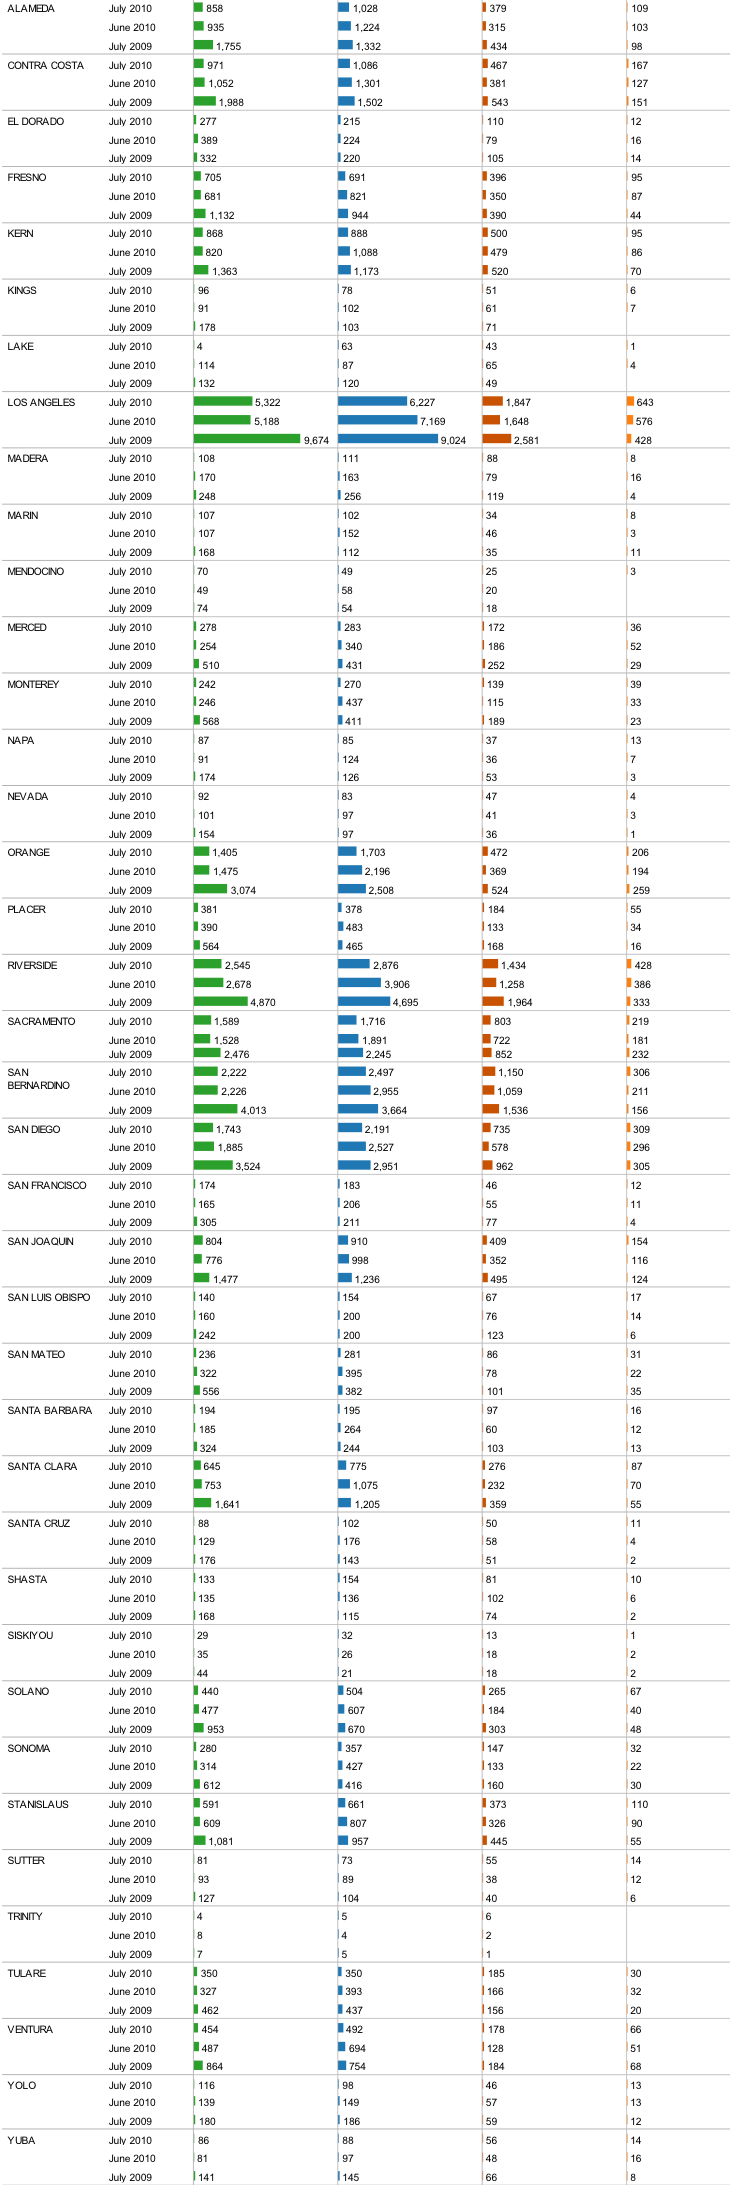
Foreclosure Activity By County
Notice of Default Notice of Trustee Sale Back to Bank (REO) Sold to 3rd Party

.png?width=553&height=112&name=5f49742da5fd5b0119a5dba2_1007_graph_filings-1-1%20(1).png)