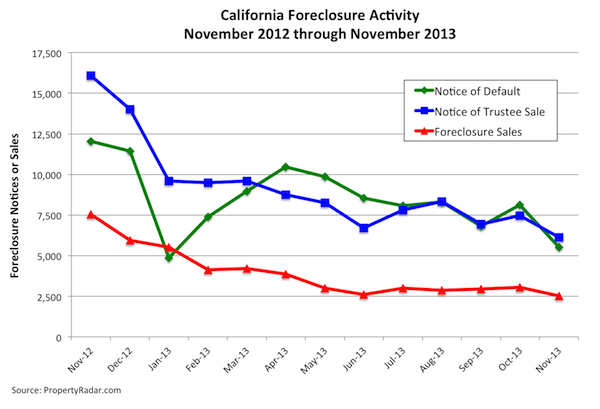
California foreclosure activity – Notices of Default, Notices of Trustee Sale and Foreclosure Sales – declined in November to its lowest levels in our records dating back to January 2007. The holidays likely were a contributing factor.
After trending mostly sideways since July, November California Notices of Default tumbled 32.0 percent for the month and are down 54.0 percent in the past 12 months. Similarly, Notices of Trustee Sale fell 17.8 percent and are down 61.9 percent for the year. Foreclosure sales declined 17.7 percent for the month and sank 66.5 percent for the year.
Splitting November foreclosure sales into their respective components — Sold to Third Party and Back to Bank (REO) — Sold to Third Party sales fell 23.3 percent in November and 71.9 percent over the past 12 months. Meanwhile, REOs have been trending mostly sideways since July, oscillating around the 1,700-per-month level. REOs plunged in the month of June because banks were digesting new federal foreclosure rules published in an Office of the Comptroller of the Currency (OCC) guidance letter that specified minimum standards for handling borrower files subject to foreclosure. REOs dropped 14.4 percent in November but are up 41.9 percent since June. Despite the bounce since June, REOs have fallen 63.0 percent.
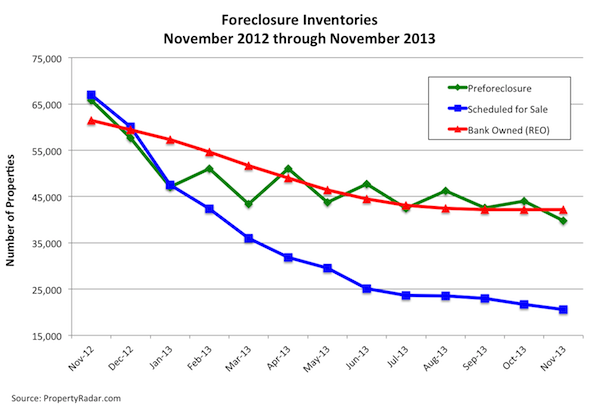
In November 2013, foreclosure inventories – Preforeclosure, Scheduled for Trustee Sale, and Bank Owned (REO) – were at or near pre-housing crisis levels. While Bank Owned (REO) inventory was nearly unchanged for the month, Preforeclosure inventory declined 9.7 percent and Scheduled for Trustee Sale inventory fell 5.7 percent. In the past 12 months, Bank Owned (REO) inventory is down 31.4 percent, while Preforeclosure and Scheduled for Trustee Sale inventories fell 39.6 and 69.3 percent, respectively.
Several factors drove November's decline in foreclosures. First, part of the decline was seasonal because banks are less likely to foreclose on homeowners during the holidays. Additionally, the recovery in California's housing market has lifted tens of thousands of homeowners out of a negative equity position, reducing the likelihood of default. It is important to keep in mind, though, that far more homeowners remain in default than in foreclosure, and that 20 percent, or 1.4 million, California homeowners are still underwater.
November Foreclosure Stats and Trends, by State
For a complete summary of November foreclosure stats and trends for California, Arizona, Nevada, Oregon, and Washington, please click on the following links:
Note: Month-to-month changes are in parentheses.
California foreclosure stats and trends
Foreclosure starts: 5,531 (-32.0%)
Foreclosure sales: 2,534 (-17.7%)
Foreclosure Bank Owned (REO) Inventories: 42,172 (+0.1%)
Arizona foreclosure stats and trends
Foreclosure starts: 1,879 (-21.3%)
Foreclosure sales: 1,116 (-12.8%)
Foreclosure Bank Owned (REO) Inventories: 11,857 (+1.8%)
Nevada foreclosure stats and trends
Foreclosure starts: 809 (-9.2%)
Foreclosure sales: 437 (-28.5%)
Foreclosure Bank Owned (REO) Inventories: 4,557 (+0.3%)
Oregon foreclosure stats and trends
Foreclosure starts: 66 (+0.0%)
Foreclosure sales: 25 (-13.8%)
Foreclosure Bank Owned (REO) Inventories: 1,230 (-1.1%)
Washington foreclosure stats and trends
Foreclosure starts: 1,772 (-10.3%)
Foreclosure sales: 857 (-18.1%)
Foreclosure Bank Owned (REO) Inventories: 8,450 (-0.5%)
PropertyRadar Methodology
California real estate data presented by PropertyRadar, including analysis, charts, and graphs, is based upon public county records and daily trustee sale (foreclosure auction) results. Items are reported as of the date the event occurred or was recorded with the California county. If a county has not reported complete data by the publication date, we may estimate the missing data, though only if the missing data is believed to be 10 percent or less of all reported data.
