California August foreclosure sales fell 5.5 percent from July. Despite August’s decline, foreclosure sales have been trending mostly sideways since May. The bottom-bouncing trend reflects the recovery in the California real estate market and the overall decline in the pipeline of Notices of Default (NODs) and Notices of Trustee Sale (NTS).
Splitting August foreclosure sales into their respective components — Sold to Third Party and Back to Bank (REO) — Sold to Third Party sales fell 19.7 percent in August while REOs surged 7.2 percent. Beginning in the later part of July, several of the largest banks resumed foreclosure sales following a temporary pause due to an Office of the Comptroller of the Currency (OCC) guidance letter that specified minimum standards for handling borrower files subject to foreclosure. Over the past 12 months, Sold to Third Party and REO sales are down 69.4 percent and 72.3 percent, respectively.
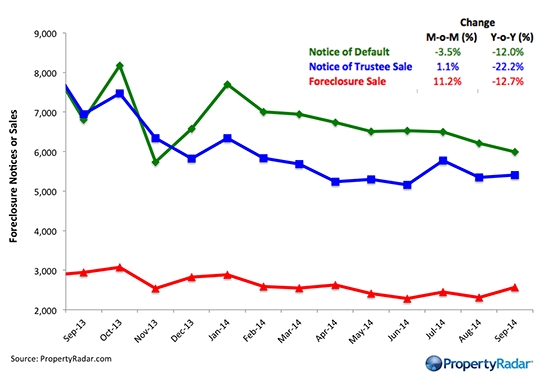
Notices of Default (NODs) in California dipped 0.7% in August and fell 55.0 percent for the year. Notices of Trustee Sale (NTS) were up 3.1 percent for the month but down 50.6 percent for the year.
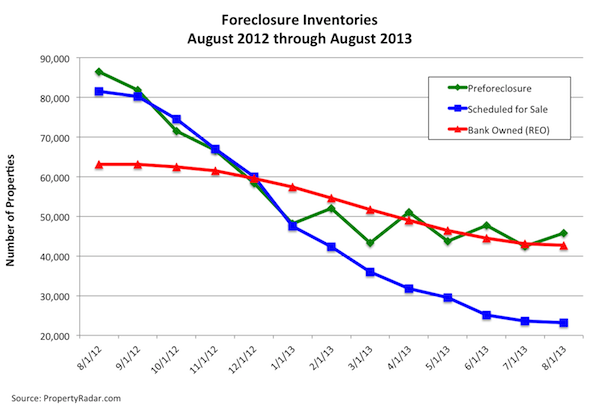
In general, foreclosure inventories continue to decline, mirroring the NOD and NTS trends. Preforeclosure inventories rose 8.0 percent in August but have fallen 47.0 percent for the year. Scheduled for Trustee Sale inventory fell 1.6 percent for the month and is down 71.5 percent for the year. Bank Owned (REO) inventory was nearly unchanged for the month, edging down 0.9 percent in August and sliding 32.4 percent for the year.
Foreclosures have declined over the past year because:
- The California real estate recovery and the low inventory of homes for sale have pushed home prices higher, reducing the number of homeowners who owe more than their homes are worth and making them eligible to refinance or sell their homes.
- The California Homeowner Bill of Rights prevents dual-tracking, which is lengthening the time to foreclose.
Since the beginning of summer, however, there has been a noticeable decrease in the rate of decline as the foreclosure market approaches a more normal foreclosure-activity state.
August Foreclosure Stats & Trends, by State
For a complete summary of August foreclosure stats and trends, please click on the following links:
Note: The numbers in parentheses indicate over-the-month changes.
California foreclosure stats and trends
Foreclosure starts: 7,970 (-0.7%)
Foreclosure sales: 2,818 (-5.5%)
Arizona foreclosure stats and trends
Foreclosure starts: 2,145 (-10.4%)
Foreclosure sales: 1,396 (-15.1%)
Nevada foreclosure stats and trends
Foreclosure starts: 1,972 (+56.0%)
Foreclosure sales: 591 (-14.5%)
Oregon foreclosure stats and trends
Foreclosure starts: 44 (-34.3%)
Foreclosure sales: 32 (+68.4%)
Washington foreclosure stats and trends
Foreclosure starts: 2,074 (+9.9%)
Foreclosure sales: 1,330 (-5.3%)
