Bloom Off the California Real Estate Rose
August 2014 Sales Down 13.5 Percent from August 2013
Median Prices Fall in Half of California’s Largest 26 Counties
In August 2014, 34,269 California single-family homes and condominiums were sold, down 4.2 percent from July’s total of 35,787 and a decline of 13.5 percent from 39,614 sales in August 2013. August 2014 sales were the lowest August sales since 2010. On a regional basis, over the past 12 months sales are down 15.7 percent in the Bay Area, 16.7 percent in Southern California, and 18.8 percent in the Central Valley.
“The bloom is definitely off the California real estate rose,” said Madeline Schnapp, Director of Economic Research for PropertyRadar. “The rapid rise in prices over the past two years has outstripped the ability of many would-be California homeowners to purchase.”
The rapid disappearance of distressed properties available for sale has been a key factor depressing sales. Whereas in August 2013 24.0 percent of sales were distressed properties, in August 2014 distressed property sales comprised only 16.7 percent of the total. In August 2011, 54.7 percent of sales were distressed property sales.
The August 2014 median price of a California home was 390,000 dollars, unchanged from July. On a year-ago basis, median home prices gained 8.3 percent, the slowest monthly gain since June 2012. Month-over-month price variations are impacted heavily by the sales of non-distressed properties, which in August comprised 83.3 percent of total sales. The median price of non-distressed homes fell 0.5 percent for the month while the median price of distressed homes gained 2.8 percent. The lack of movement in median prices this past month was due mostly to a shift from less expensive to more expensive homes, not a change in underlying home values.
On a county level, median price increases have slowed or peaked in many of California’s largest counties. In August, 13 of California’s 26 largest counties experienced monthly price declines compared to only six in March.
In other California housing news:
- Negative equity continues to decline but remains at historically high levels. In August, slightly more than 1.0 million California homeowners, or 11.6 percent were underwater. Historically elevated levels of negative equity will continue to exert a drag on the California real estate market
- Cash sales totaled 7,547 in August and were 22.0 percent of total sales. Cash sales have been steadily declining, down 46.2 percent, since reaching a peak of 14,028, or 40.0 percent of total sales in August 2011.
- Flip sales fell 2.3 percent for the month and are down 36.5 percent for the year. Flip sales are defined as properties that have been resold within six months. Flip sales peaked in October 2012 and have declined 38.2 percent.
- Institutional Investor LLC and LP purchases edged up 0.9 percent for the month but are down 23.0 percent from August 2013. As the supply of distressed properties dwindle and prices rise, institutional investor demand has retreated due to the lower return on investment. In general, Institutional Purchases have posted consistent monthly declines since peaking in December 2012 and are down 43.9 percent since then. Trustee sale purchases by LLC and LPs are down nearly 83.6 percent from their October 2012 peak.
- Foreclosure starts, Notices of Default (NODs), fell 6.8 percent between July and August and are down 27.3 percent from August 2013. The downward trend extends a longer-term downward trend that began in March 2009. Foreclosure sales declined 6.0 percent for the month and are down 19.5 percent for the year.
Home Sales
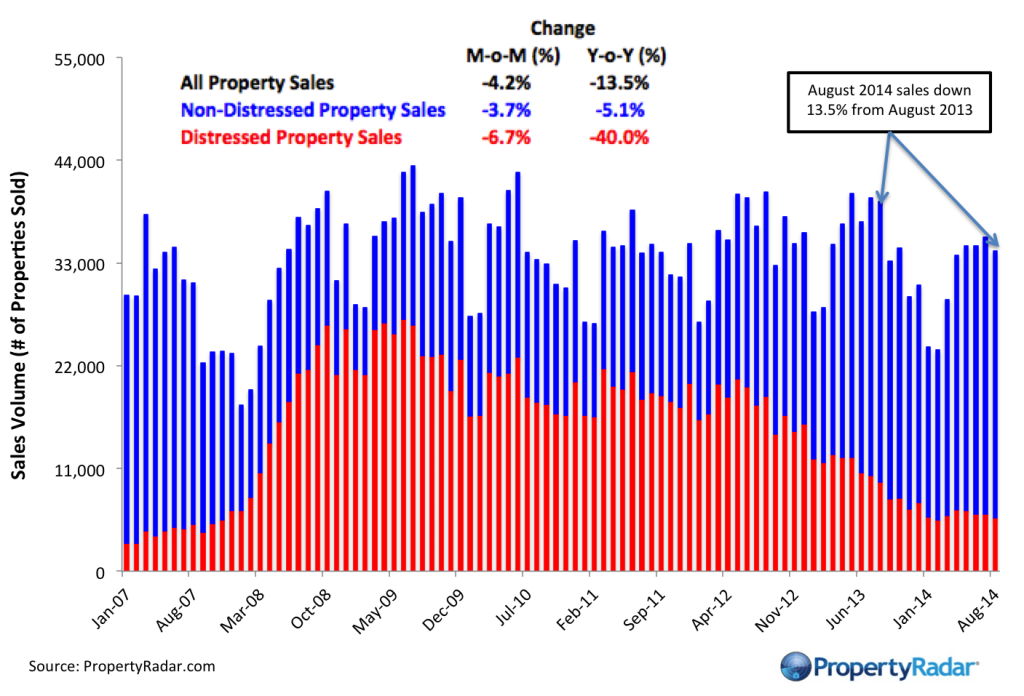
Home Sales - Single-family residence and condominium sales by month from 2007 to current divided into distressed and non-distressed sales. Distressed sales are the sum of short sales, where the home is sold for less than the amount owed, and REO sales, where banks resell homes that they took ownership of after foreclosure. All other sales are considered non-distressed.
Year-over-Year Home Sales
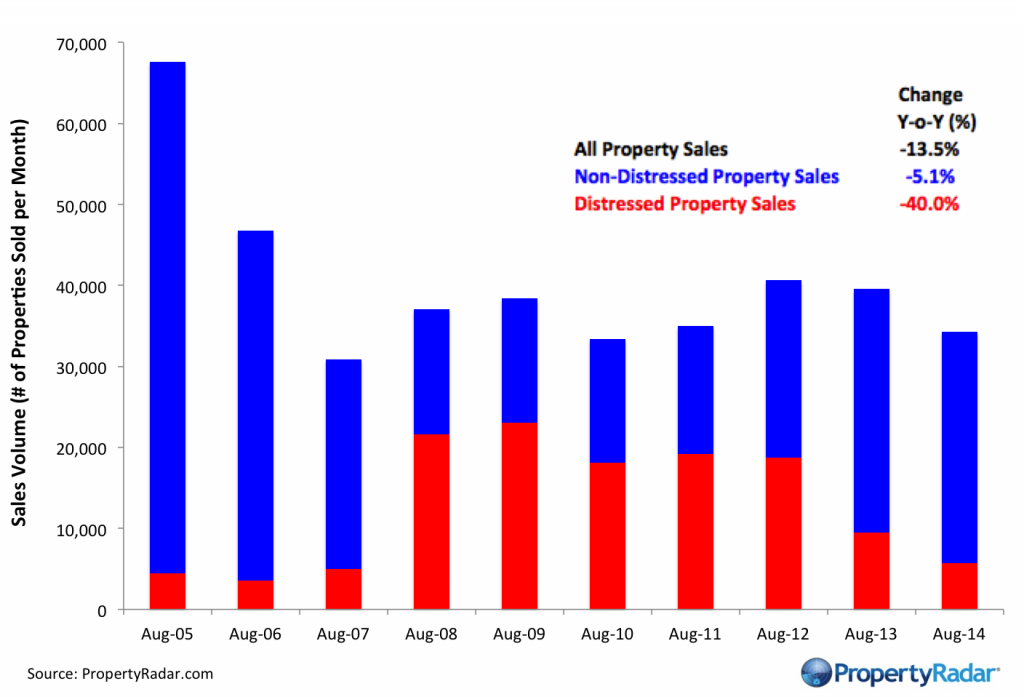
Year-over-Year Home Sales - Single-family residences and condominiums sold during the same month for the current year and prior years divided into distressed and non-distressed sales.
Median Sales Prices vs. Sales Volume
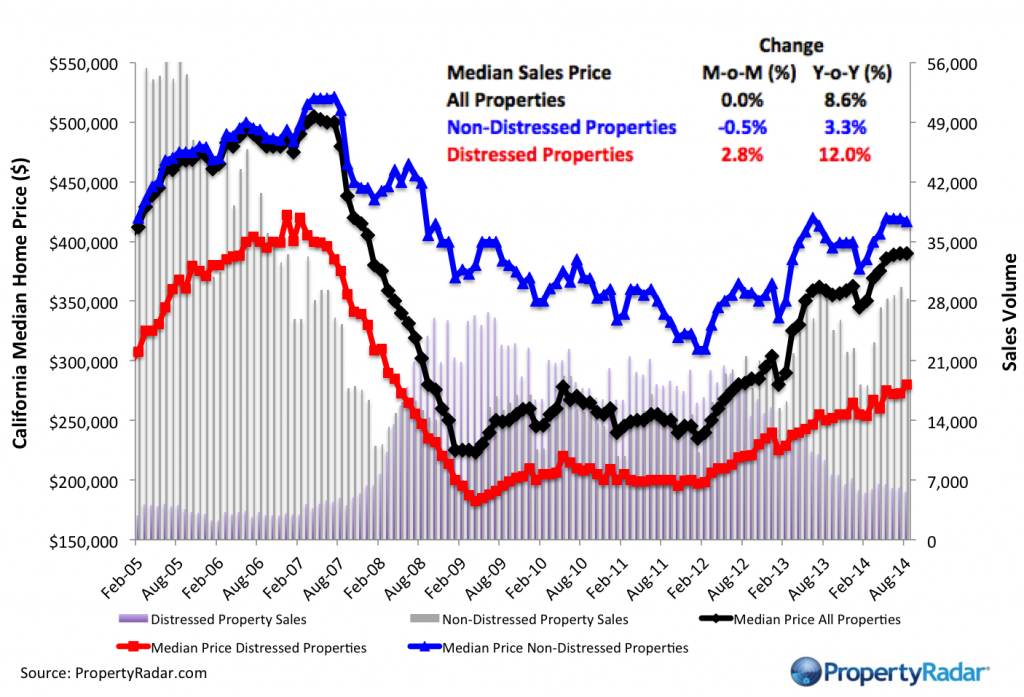
Median Sales Price vs. Sales Volume - Median sales price (left axis) of a California single-family home versus sales volume (right axis), by month from 2005 to current. Median sales prices are divided into three categories: All single-family homes (blue line), distressed properties (red line), and non-distressed properties (green line). Monthly sales volume (right axis) are illustrated as gray and lavender bars. The gray bars are distressed sales and the lavender bars are non-distressed sales.
California Homeowner Equity
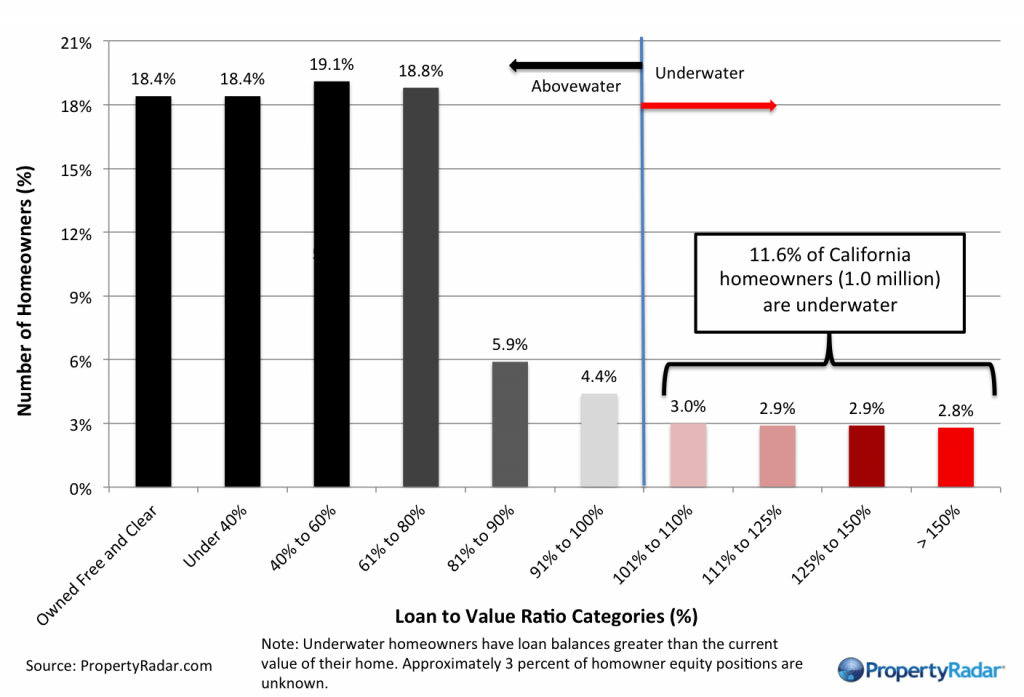
California Home Owner Equity - A model estimate of California homeowners segregated into various categories of levels of homeowner equity for a given month. Homeowner numbers represent a percentage of total California homeowners.
Cash Sales
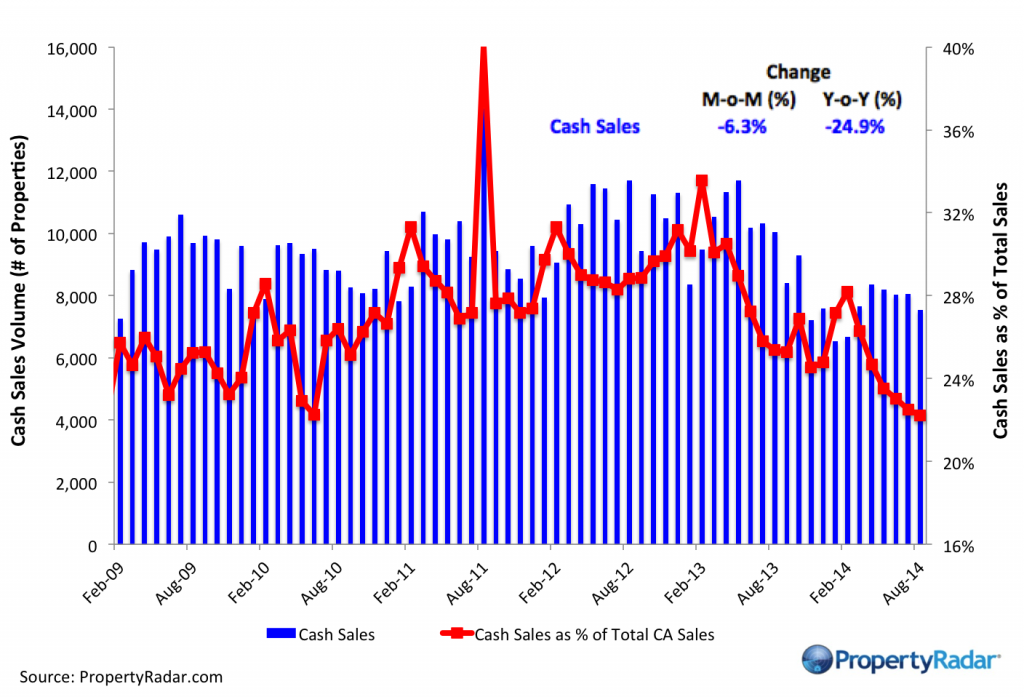
Cash Sales - The blue bars (right axis) illustrate cash sales of single-family residences and condominiums by month. The red line (left axis) illustrates cash sales as a percentage of total sales by month.
Flipping
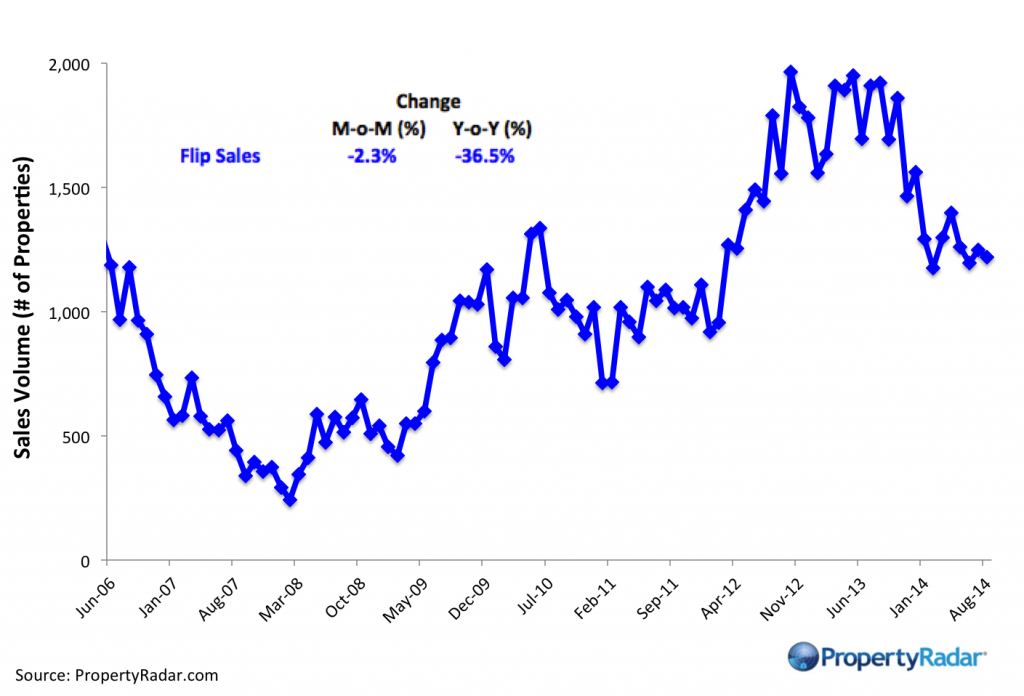
Flipping – The number of single-family residences and condominiums resold within six months.
Market Purchases by LLCs and LPs
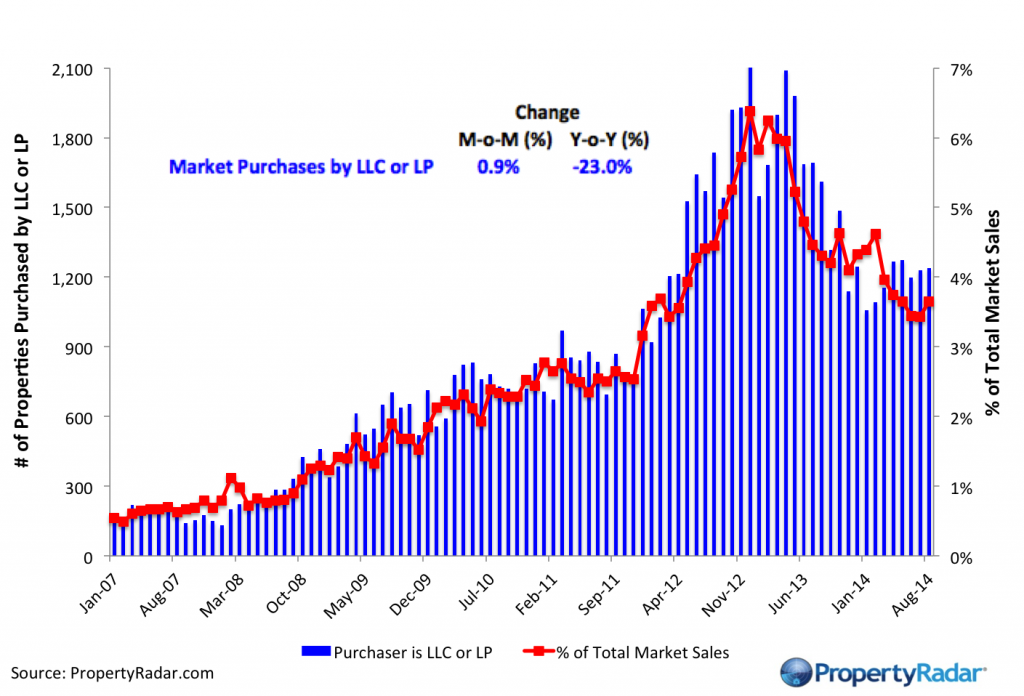
Market Purchases by LLCs and LPs - The blue bars (right axis) illustrate market purchases of single family residences and condominiums by LLCs and LPs from 2007 to current. The red line graph (left axis) illustrates LLC and LP purchases as a percentage of total sales by month.
Market Sales by LLCs and LPs
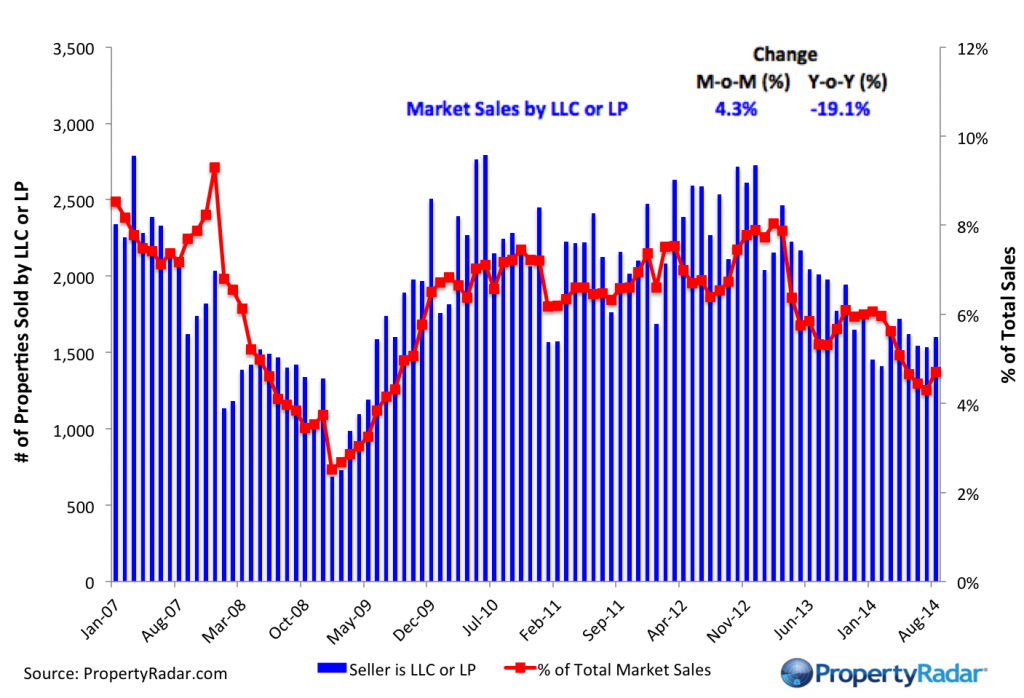
Market Sales by LLCs and LPs - The blue bars (right axis) illustrate market sales by LLCs and LPs of single-family residences and condominiums by month. The red line graph (left axis) illustrates sales as a percentage of total sales by month.
Trustee Sale Purchases by LLCs and LPs
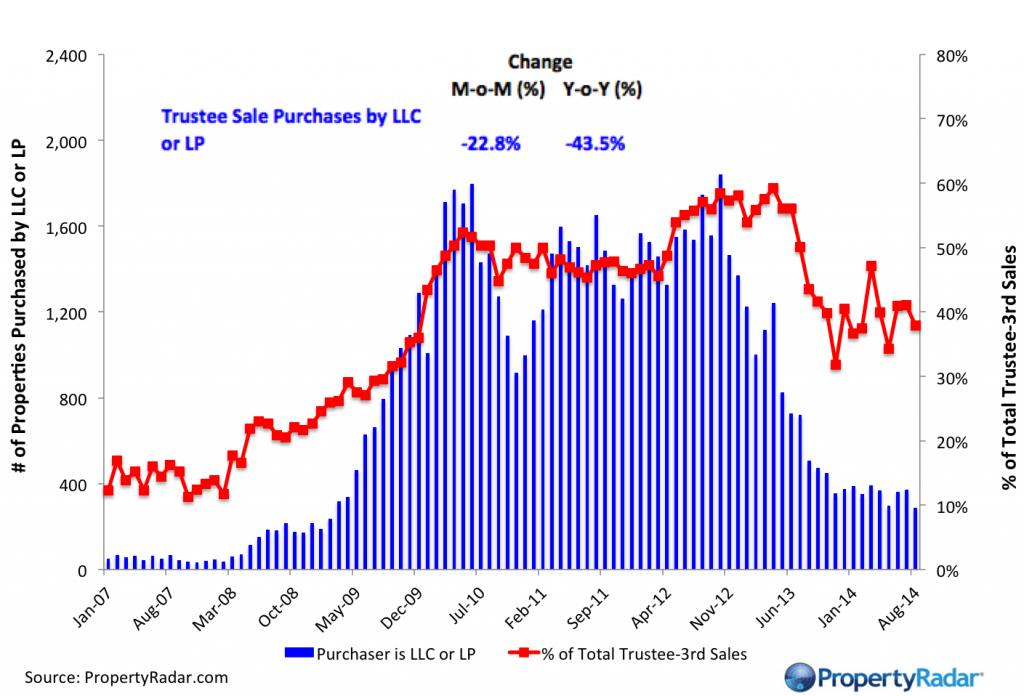
Trustee Sale Purchases by LLCs and LPs - The blue bars (right axis) illustrate trustee sale purchases (foreclosure sales) of single-family residences and condominiums by LLCs and LPs from 2007 to current. The red line graph (left axis) illustrates purchases as a percentage of total trustee sales by month.
Foreclosure Notices and Sales
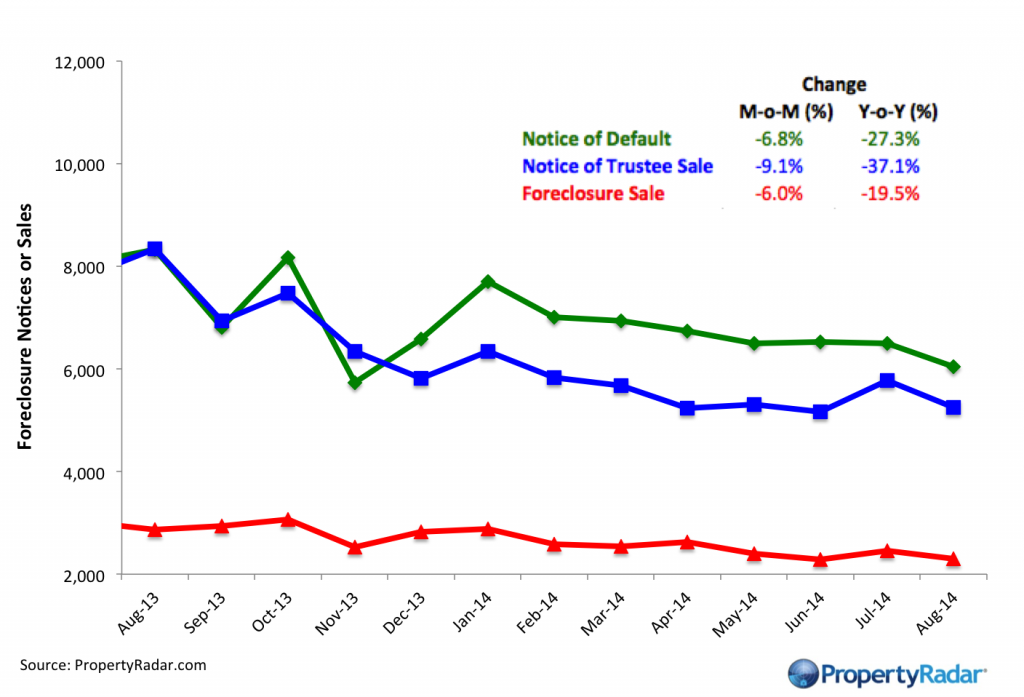
Foreclosure Notices and Sales - Properties that have received foreclosure notices — Notice of Default (green) or Notice of Trustee Sale (blue) — or have been sold at a foreclosure auction (red) by month.
Foreclosure Inventories
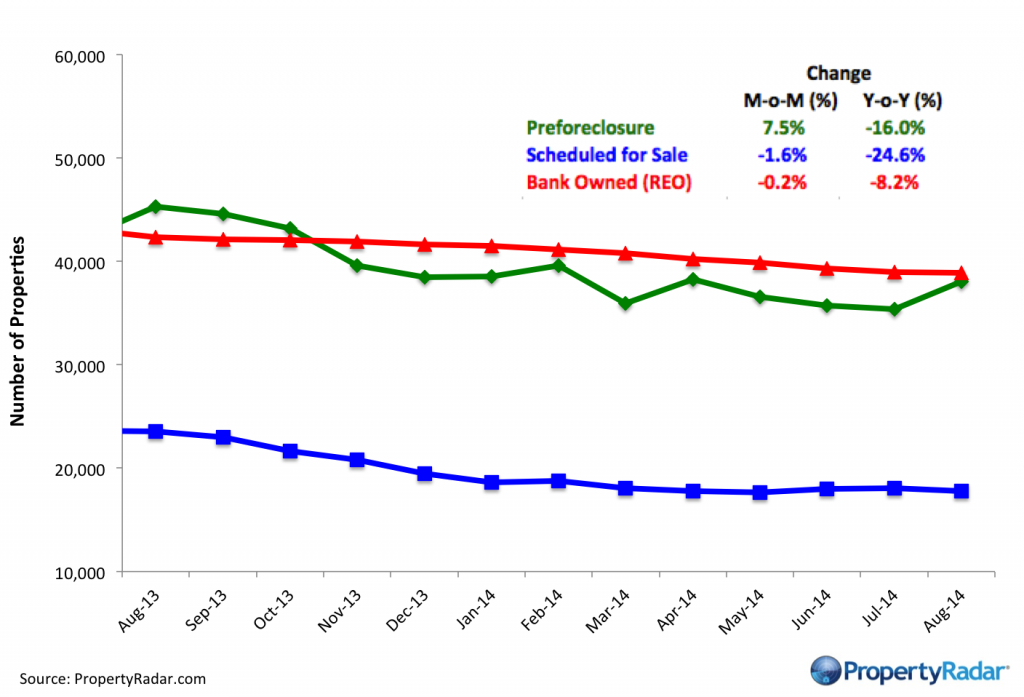
Foreclosure Inventory - Preforeclosure inventory estimates the number of properties that have had a Notice of Default filed against them but have not been Scheduled for Sale, by month. Scheduled for Sale inventory represents properties that have had a Notice of Trustee Sale filed but have not yet been sold or had the sale cancelled, by month. Bank-Owned (REO) inventory means properties sold Back to the Bank at the trustee sale and the bank has not resold to another party, by month.
Real Property Report Methodology
California real estate data presented by PropertyRadar, including analysis, charts, and graphs, is based upon public county records and daily trustee sale (foreclosure auction) results. Items are reported as of the date the event occurred or was recorded with the California county. If a county has not reported complete data by the publication date, we may estimate the missing data, though only if the missing data is believed to be 10 percent or less of all reported data.
