
California Property Reports
Market Activity
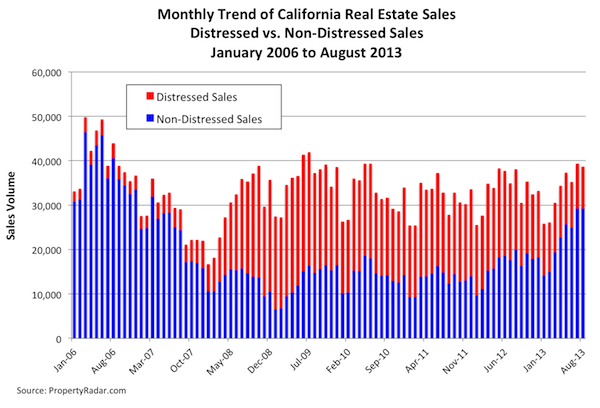
August 2013 California single-family residences (SFR) and condominium (CND) sales (distressed and non-distressed) fell 1.8 percent from July but gained 1.5 percent in the past 12 months (y-o-y). A 7.3 percent monthly drop in sales of distressed properties drove the decline in August sales.
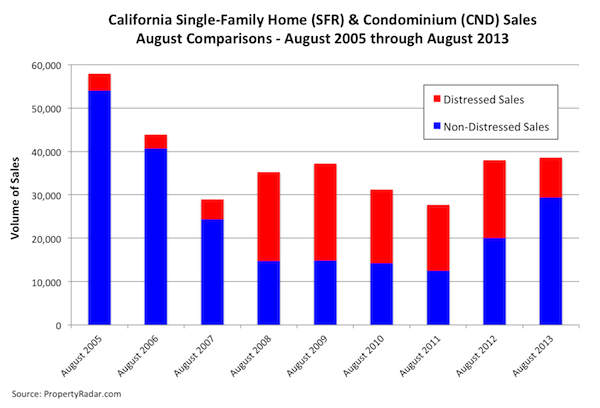
To get a clearer picture of current real estate sales trends and to eliminate seasonal factors, we compare August 2013 distressed and non-distressed property sales to August sales in prior years. August 2013 sales were the highest since August 2006. Dividing sales into their distressed and non-distressed components, distressed property sales fell 48.6 percent in the past 12 months, while non-distressed property sales jumped 46.6 percent. Despite the decline in distressed property sales, in August distressed properties accounted for 24.0 percent of total sales, which is historically still very high.
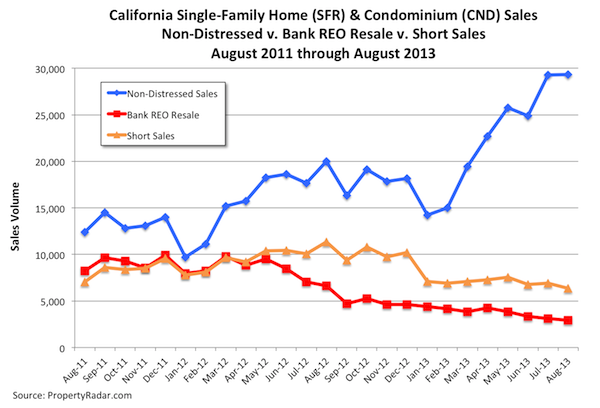
We can divide distressed property sales further into short sales and bank REO resales to get a better understanding of underlying trends. In August, short sales fell 8.0 percent and are down 44.1 in the past 12 months. Also, bank REO resales are down 5.7 percent for the month and down 56.1 percent for the year.
Homeowner Equity
Large numbers of underwater homeowners remain a drag on the California real estate market. In August, 1.2 million (18 percent) of California's 6.8 million homeowners were moderately to severely underwater while 750,000 (11 percent) were either barely above water (less than 10 percent equity in their homes) or barely underwater. Since closing costs associated with the sale of a home typically are 6 to 10 percent of a home's sale price, these homeowners are effectively underwater. Added together, 2.0 million, or 29 percent, of underwater and barely-above-water homeowners are effectively shut out of the California real estate market.
Median Prices
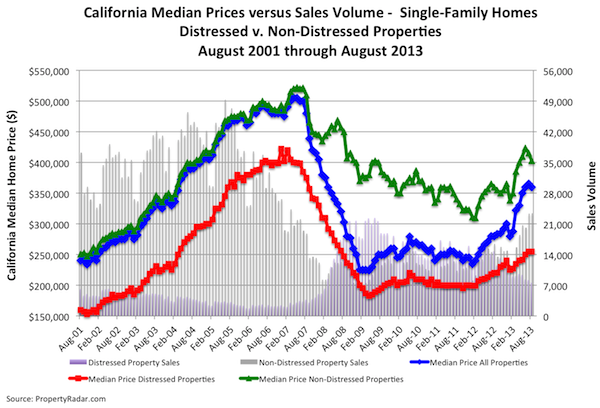
The August median sale price of a California home fell 1.4 percent to $360,000 from $365,000 in July, the first monthly decline since January. Year-over-year growth in median prices has slowed: the 28.6 percent jump in median sales prices ($360,000 in August 2013 vs. $280,000 in August 2012) was down 1.8 percentage points from the 30.4 percent year-over-year change in July 2013, and down 4.2 percentage points from the 32.8 percent year-over-year change in June 2013.
Rapid changes in the mix of distressed and non-distressed property sales from 2012 to 2013 continue to influence the year-over-year change in median prices. In August 2012, distressed property sales accounted for 47.4 percent of sales. By August 2013, distressed property sales had fallen to 24.0 percent of sales.
The following graph highlights median sales price trends from August 2001 to August 2013. Aggregate single-family home median sales prices are shown in blue, and distressed and non-distressed median prices are shown in red and green, respectively.
When we compute year-over-year growth in median prices for the individual components of aggregate sales — distressed and non-distressed properties — we find that since June, growth in the median prices of both components has slowed considerably on a year-ago basis.
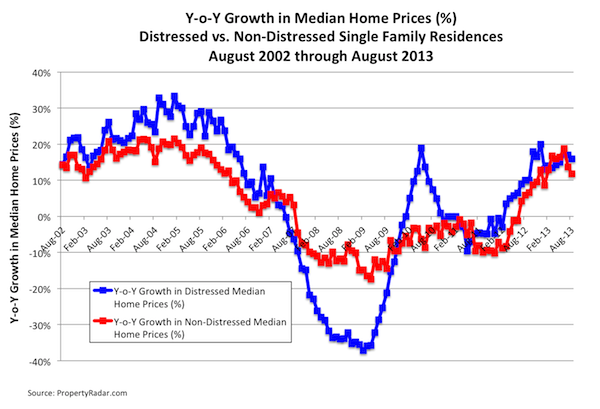
Note: The May 2010 spike in the y-o-y growth of distressed property median prices was due to lack of distressed property inventory during the 2009 and 2010 robo-signing scandal.
Cash Sales
In August 2013, cash sales represented 24.0 percent of total sales, down 2.1 percentage points from 26.1 percent in July. Taking a longer-term view, cash sales as a percent of total sales oscillated between 28 percent and 31 percent from January 2012 through January 2013. They peaked at 33.0 percent in February 2013 and have been below 28 percent since May 2013. From a historic perspective, cash sales remain high and are an important part of the real estate marketplace even though they are trending lower now.
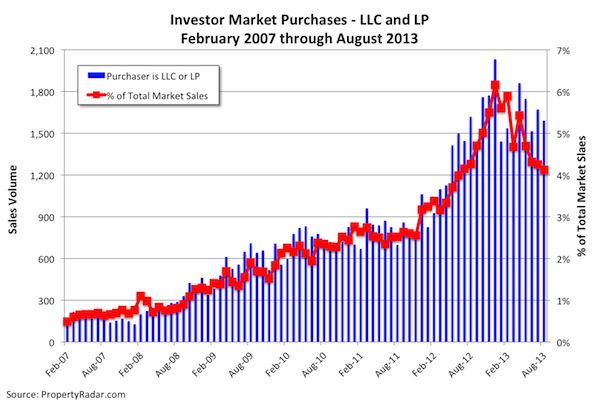
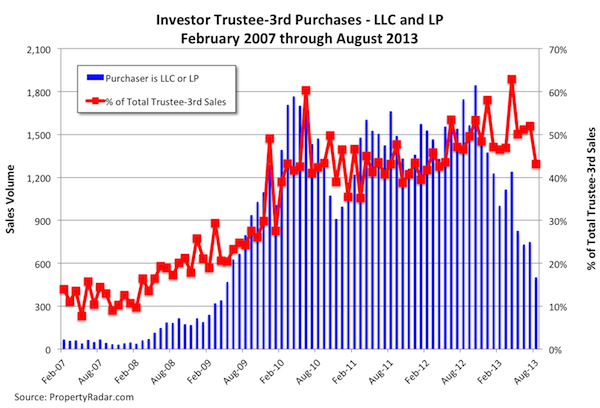
Investor (LLC and LP) Purchases
August 2013 investor purchases, defined as a market or third party purchase at a trustee sale by a limited liability corporation (LLC) or a limited partnership (LP), fell 13.4 percent from July. Investor market purchases declined 4.7 percent and investor-third party purchases sank 32.8 percent for the month. In general, investor purchases have been trending lower since late last year. Investor market purchases have fallen 21.6 percent since peaking in December 2012, while investor trustee-third party purchases are down 72.7 percent since October 2012.
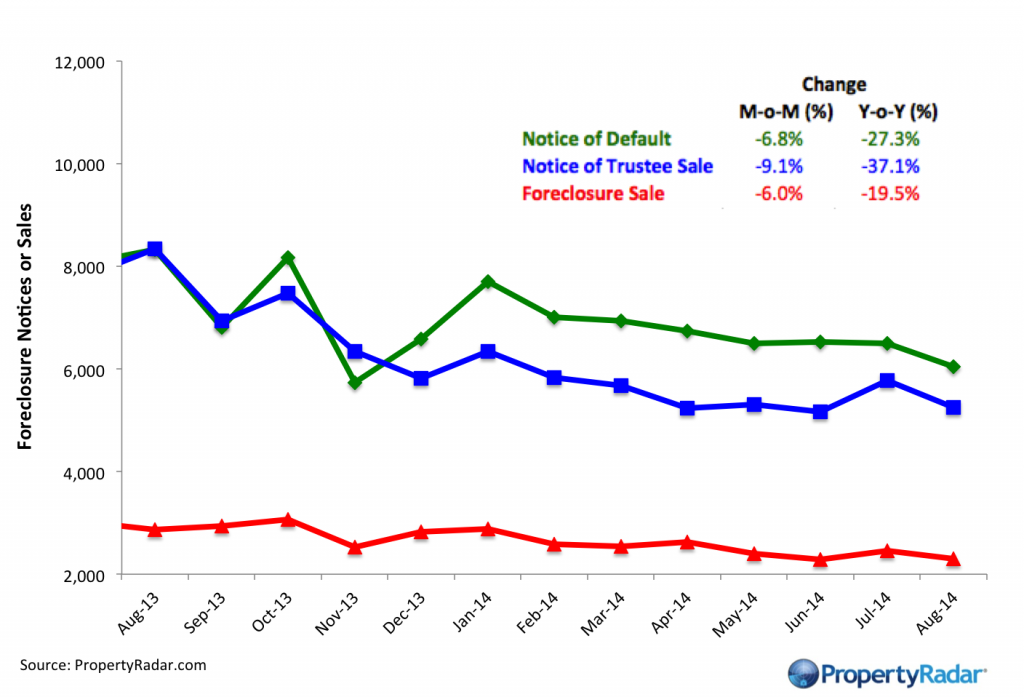
Foreclosures
August foreclosure sales fell 5.5 percent from July. Splitting August foreclosure sales into their respective components — Sold to Third Party and Back to Bank (REO) — Sold to Third Party sales fell 19.7 percent in August while REOs surged 7.2 percent. Beginning in the latter part of July, several of the largest banks resumed foreclosure sales following a temporary pause due to an Office of the Comptroller of the Currency (OCC) guidance letter that specified minimum standards for handling borrower files subject to foreclosure. Over the past 12 months, Sold to Third Party and REO sales are down 69.4 percent and 72.3 percent, respectively. Since May, both Notices of Trustee Sale and Foreclosure Sales appear to have bottomed and are trending sideways.
Madeline’s Take – Director of Economic Research, PropertyRadar
What caught my eye this month is both August sales and median prices fell simultaneously for the first time since January. After a 12.0 percent pop in July, August sales fell 1.8 percent as the California real estate market digested a 100 basis point increase in mortgage interest rates in mid-June. The decline in August sales caused the nearly uninterrupted 20-month increase in median home prices to finally take a breather.
This will be an interesting trend to watch. The combination of the rapid increase in mortgage interest rates and decline in sales, primarily due to the decline in distressed property sales, cash sales and investor purchases, will likely result in decreased demand. The decrease in demand, in turn, will likely depress prices and cause an increase in inventory.
Assuming interest rates don’t rise much further, the increase in inventory will be welcome news for the California real estate market, which has been challenged by an acute shortage of inventory for much of the past year. Many potential homebuyers looking to finance their home purchases have been shut out of the market due to lopsided bidding wars against cash buyers.
While mortgage interest rates have jumped in recent weeks, we doubt they will rise much further because the Federal Reserve is keenly aware of the importance of the housing market to an ongoing economic recovery. I believe the Fed is not likely to remove its support from the housing market anytime soon. Mortgage interest rates are still low by historic standards. Homebuyers with solid incomes and good credit should have an easier time finding and purchasing a home.
Addendum to Madeline's Take - 9/18/2013:
The Federal Reserve's decision to maintain current levels of stimulus is, of course, great news for the housing market. Within seconds of the Fed's announcement, yields on the 10-year Treasury note fell 10 basis points to 2.75% and will likely trend lower. Mortgage interest rates are sure to follow.
With the cloud of uncertainty gone, we believe the recent volatility in the mortgage interest rate market will likely retreat until sometime next year when talk of tapering will likely return.
In our opinion, the Fed's are keenly aware of the importance of the housing market to the economic recovery. For that reason, we doubt the Fed's will consider reducing support anytime soon.
Sean’s Take – Founder/CEO, PropertyRadar
The recent interest rate hikes should result in price declines. Homebuyers have always bought as much home as their banker told them they could afford - and they can now afford 10 percent less than they could before the rate increases. That won't happen quickly. Sellers, unlike buyers, tend not to believe that such a correction is necessary, and therefore do not drop prices to reflect what buyers can now afford. They are buoyed by mistaken analysis that because both interest rates and prices rose in the 80's, rising rates don't mean lower prices. But those were different times. Then we had high inflation, which included wage inflation, allowing buyers to digest both the rise in rates and price. That simply isn't true today. The next few months will be fascinating to watch. Will prices correct to reflect the new rates, I doubt it. More likely we will see slower sales and more inventory.
Real Property Report Methodology
California real estate data presented by PropertyRadar, including analysis, charts and graphs, is based upon public county records and daily trustee sale (foreclosure auction) results. Items are reported as of the date the event occurred or was recorded with the California county. In the event a county has not reported complete data by publication date, we may estimate the missing data, though only if said data is believed to be 10 percent or less of all reported data.