
California Property Reports
California Year-to-Date Sales Lowest Since 2007
Median Prices Hit Six-Year High
California single-family home and condominium sales gained 3.5 percent in May 2014 but were down 11.1 percent from May 2013. Year-to-date sales are the lowest since 2007. For the month, non-distressed property sales activity increased 5.0 percent while sales of distressed properties fell 0.7 percent.
“What continues to surprise us month after month is that in the fifth year of a so-called recovery, year-to-date real estate sales are on track to be the lowest since 2007,” said Madeline Schnapp, Director of Economic Research for PropertyRadar. “Government policies that constrained supply coupled with high demand from all-cash buyers pushed up real estate prices so quickly that in many parts of California the median income home buyer can no longer afford the median-priced home.”
The May 2014 the median price of a California home reached its highest level since December 2007, up 10,000 dollars, or 2.7 percent, to 385,000 dollars from 375,000 dollars in April. On a year-ago basis, median home prices gained 10.0 percent. Driving the month-over-month price increase in May was the 4.5 percent increase in the sales volume of higher-priced non-distressed properties, which accounted for nearly 81 percent of total sales. Note that when looking at only non-distressed sales, the median price rose only 2.3 percent over last year.
“The significant jump in median home prices this past month is being driven by the change in mix between the sales of distressed properties versus sales of non-distressed properties, rather than a big jump in actual home values,” said Schnapp. “Just a few years ago, distressed properties accounted for 60 to 70 percent of sales as opposed to 19 percent today. Higher priced non-distressed property sales now dominate monthly sales numbers, so it should come as no surprise that median prices are up.”
In other California housing news:
- Median home prices in four Bay Area California counties – San Francisco, Marin, Santa Clara, and San Mateo – are close to or exceed their pre-housing bubble peaks. In only 8 of California’s 26 largest counties – Kern, Merced, Riverside, San Bernardino, Solano, Stanislaus, and Tulare – can the median income homeowner in that county afford to purchase the median-priced home.
- Cash sales remained a significant percentage of total sales in May, accounting for 22.5 percent. While that total is down from 23.8 percent in April, it is important to note that prior to the collapse of the housing bubble, cash sales were only six to eight percent of total sales.
- Flip sales fell 12.4 percent for the month and were down 32.4 percent for the year.
- Underwater homeowners continue to impart negative headwinds to the California real estate recovery. In May, nearly 1.2 million California homeowners, or 13.5 percent remain underwater.
- Institutional Investor LLC and LP purchases fell 2.3 percent for the month and are down 33.1 percent from May 2013. Purchases have posted consistent monthly declines and are down 42.7 percent from their December 2012 peak. Institutional investors have slowed their investment activity in the face of higher prices and lower return on investments.
- Foreclosure sales fell 8.5 percent for the month and are down 20.1 percent for the year. The May decline continues the longer-term trend of steady monthly declines due to both a gradual recovery in the real estate market and government policies that discourage foreclosures.
“Real estate prices continue to march higher on declining sales volume which is an unhealthy combination,” said Schnapp. “At some point, you run out of buyers willing to pay these prices setting the stage for a decline in sales volume, which we are already seeing, and later for the possibility of a price correction.”
Home Sales
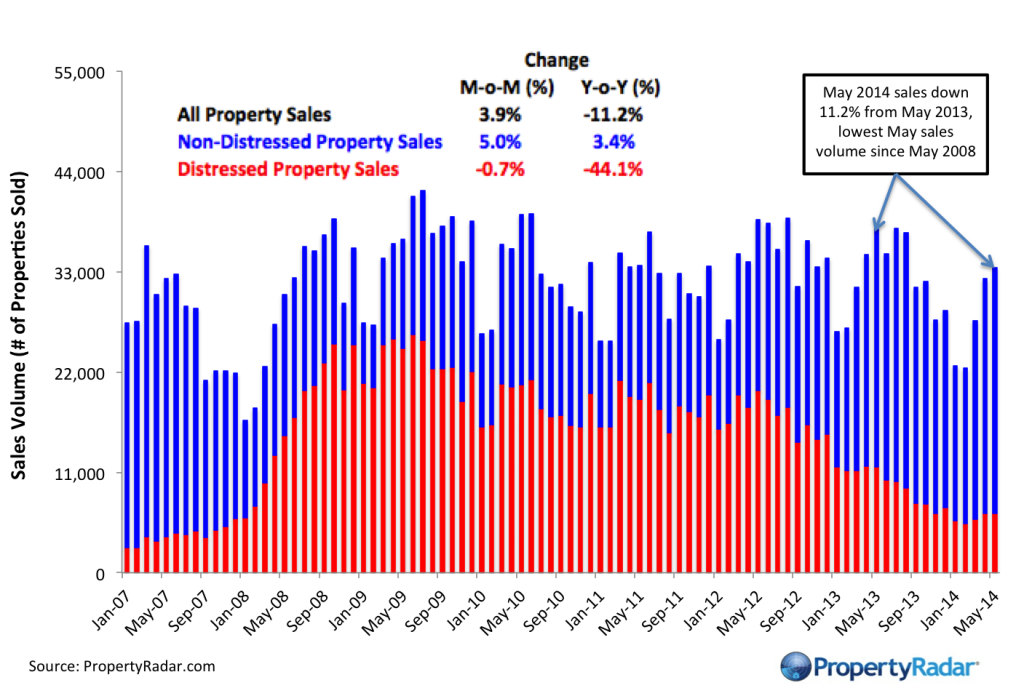
Home Sales - Single-family residence and condominium sales by month from 2007 to current divided into distressed and non-distressed sales. Distressed sales are the sum of short sales, where the home is sold for less than the amount owed, and REO sales, where banks resell homes that they took ownership of after foreclosure. All other sales are considered non-distressed.
Year-over-Year Home Sales
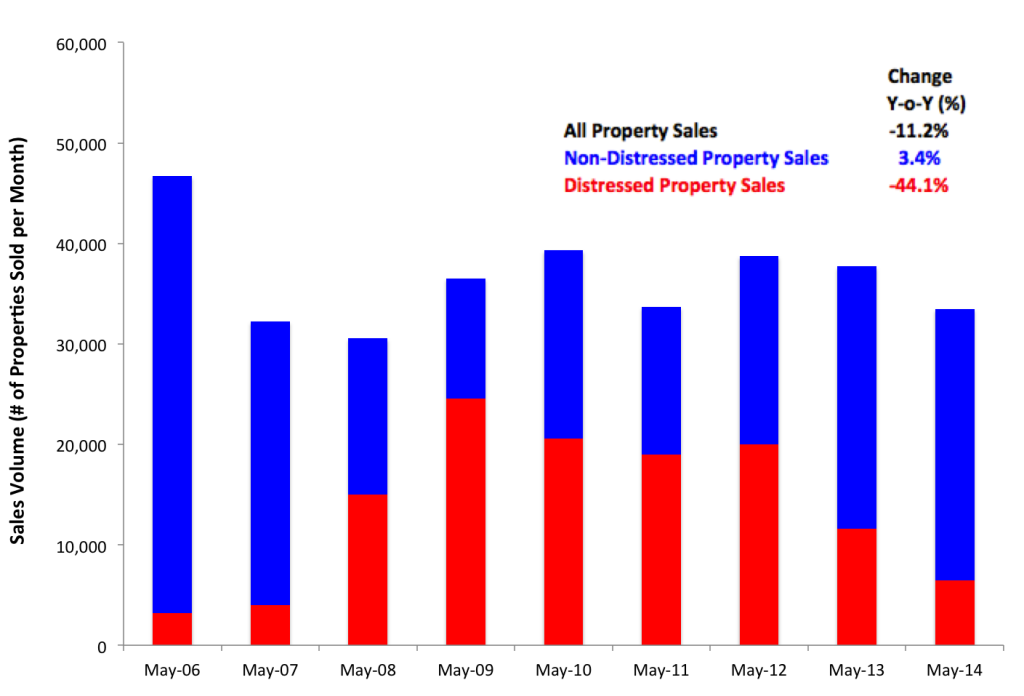
Year-over-Year Home Sales - Single-family residences and condominiums sold during the same month for the current year and prior years divided into distressed and non-distressed sales.
Median Sales Prices vs. Sales Volume
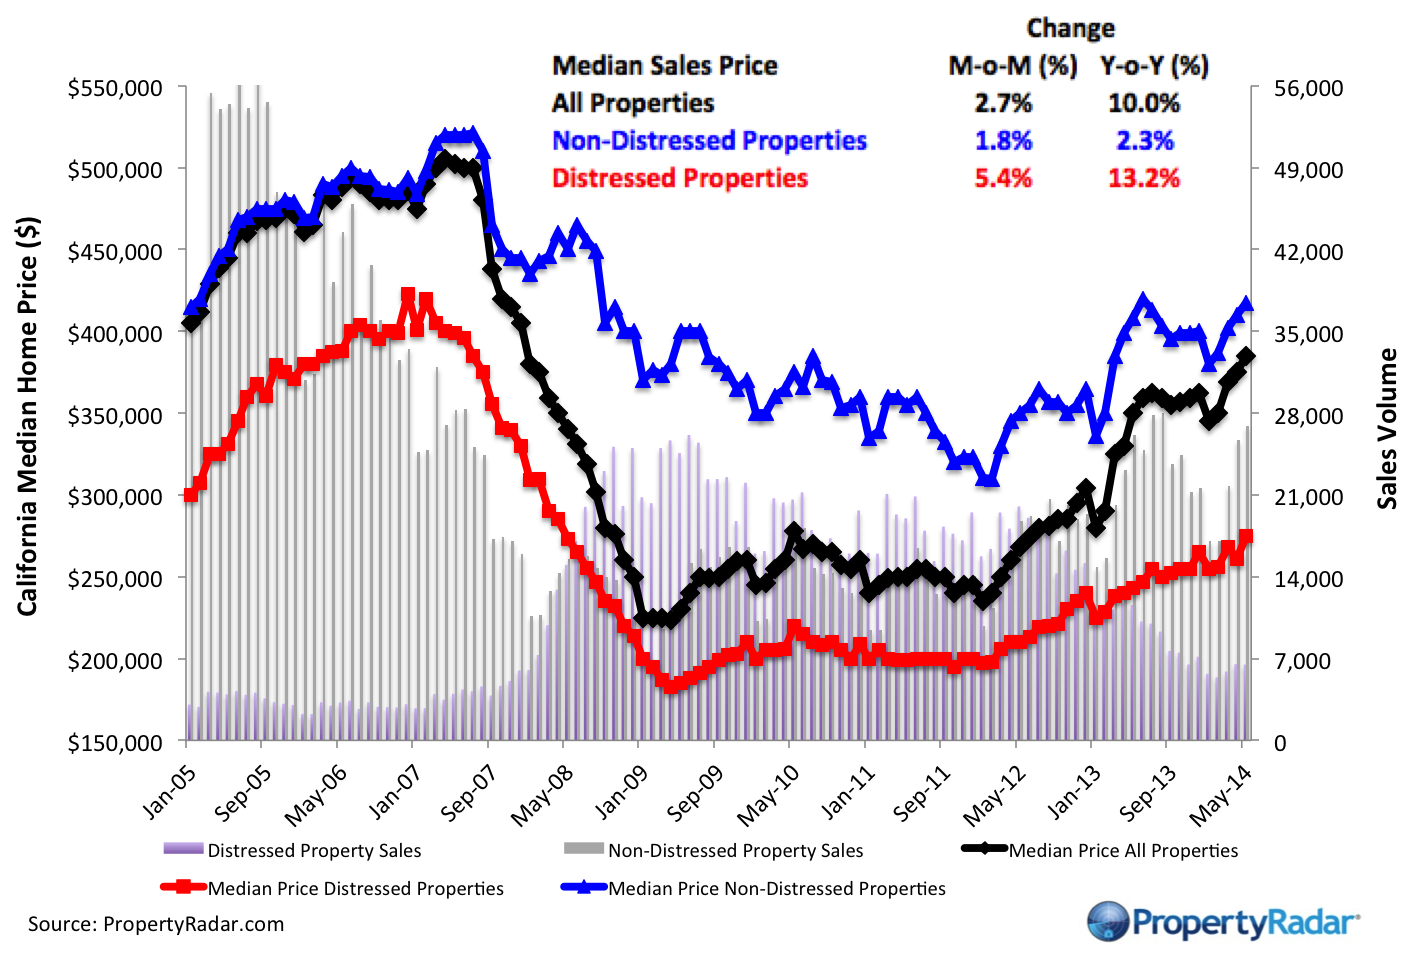
Median Sales Price vs. Sales Volume - Median sales price (left axis) of a California single family home versus sales volume (right axis), by month from 2005 to current. Median sales prices are divided into three categories: All single-family homes (blue line), distressed properties (red line), and non-distressed properties (green line). Monthly sales volume (right axis) are illustrated as gray and lavender bars. The gray bars are distressed sales and the lavender bars are non-distressed sales.
California Homeowner Equity
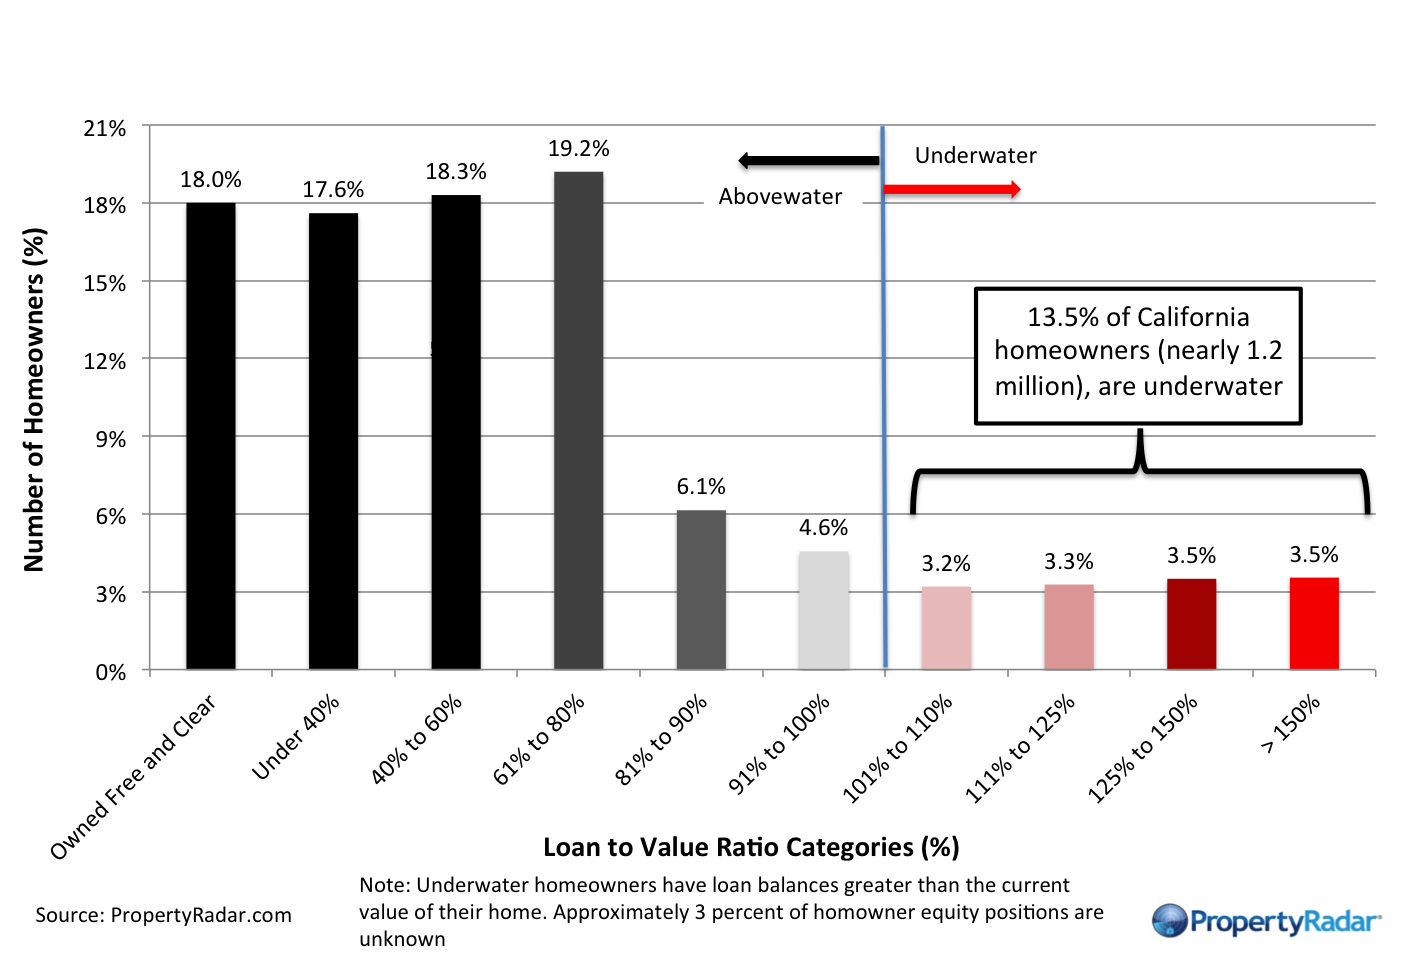
California Home Owner Equity - A model estimate of California homeowners segregated into various categories of levels of homeowner equity for a given month. Homeowner numbers represent a percentage of total California homeowners.
Cash Sales
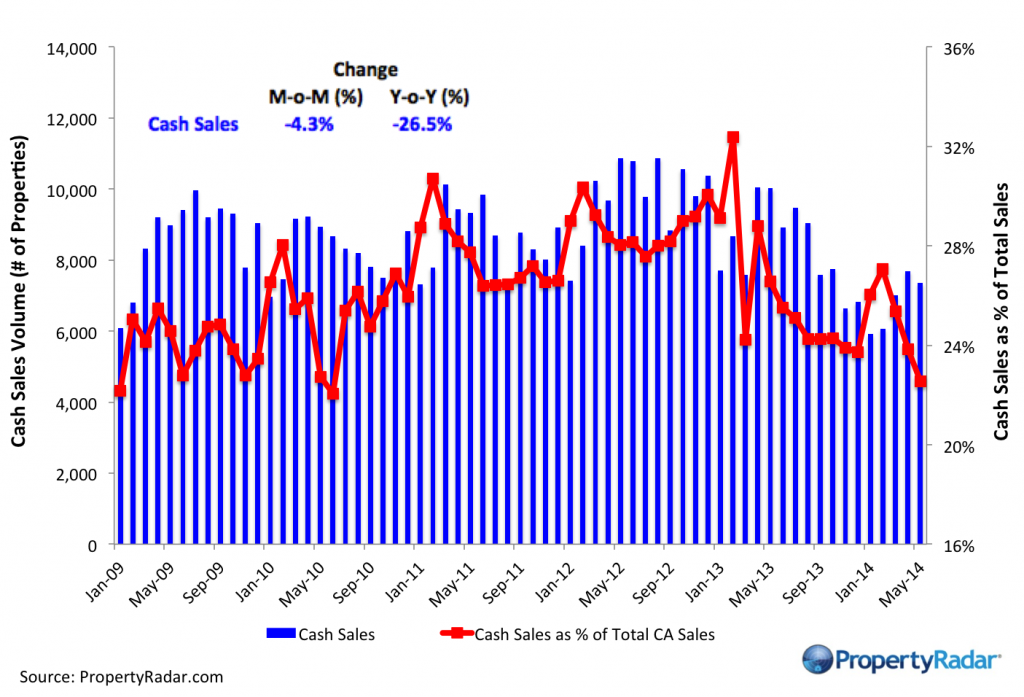
Cash Sales - The blue bars (right axis) illustrate cash sales of single-family residences and condominiums by month. The red line (left axis) illustrates cash sales as a percentage of total sales by month.
Flipping
Flipping – The number of single-family residences and condominiums resold within six months.
Market Purchases by LLCs and LPs
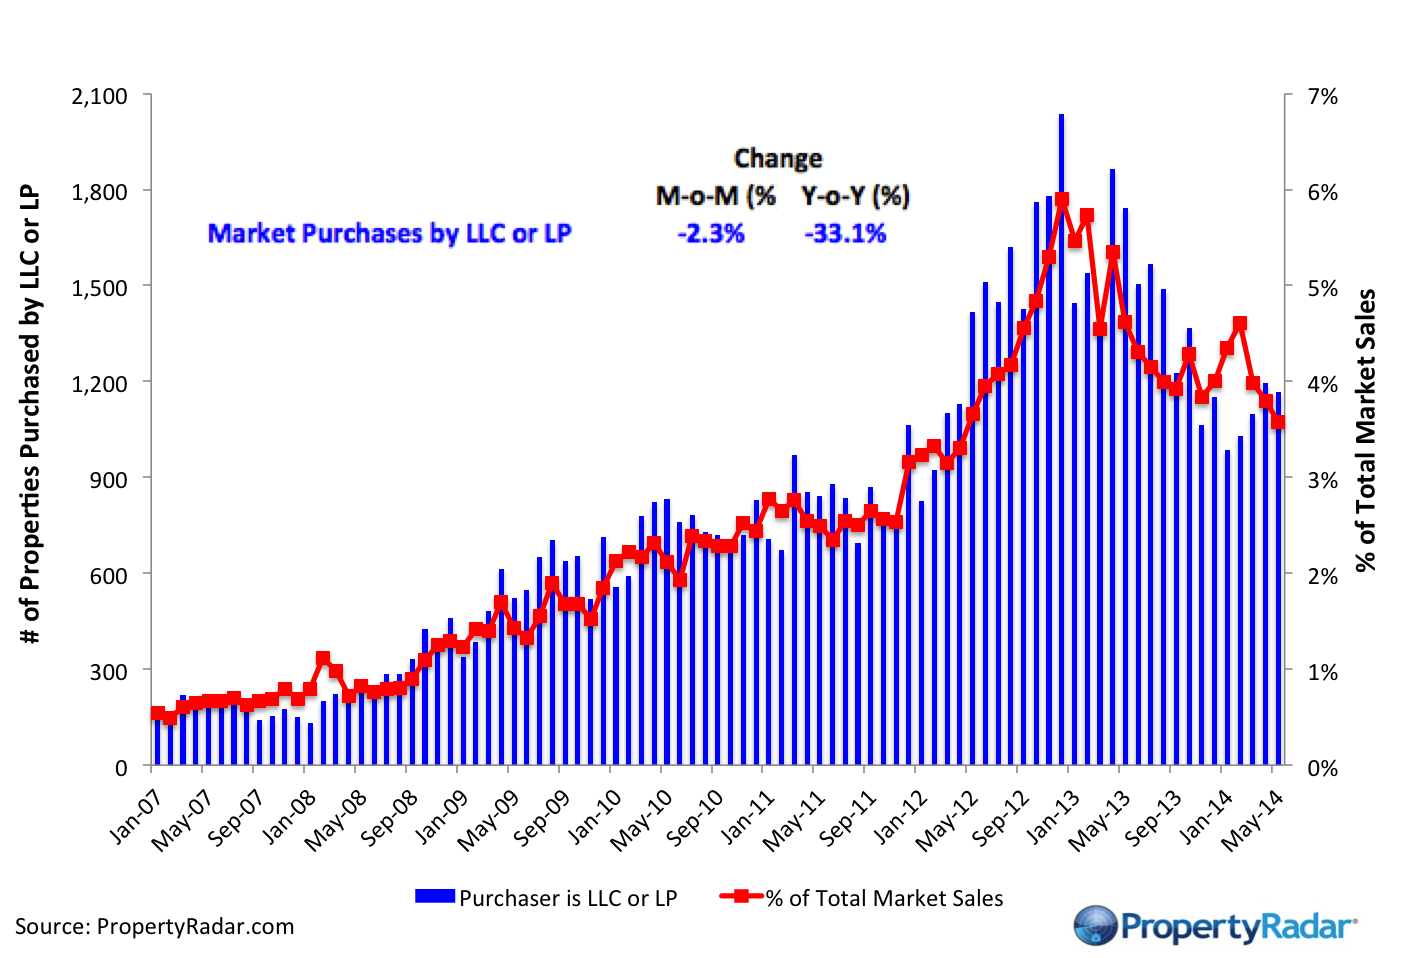
Market Purchases by LLCs and LPs - The blue bars (right axis) illustrate market purchases of single family residences and condominiums by LLCs and LPs from 2007 to current. The red line graph (left axis) illustrates LLC and LP purchases as a percentage of total sales by month.
Market Sales by LLCs and LPs
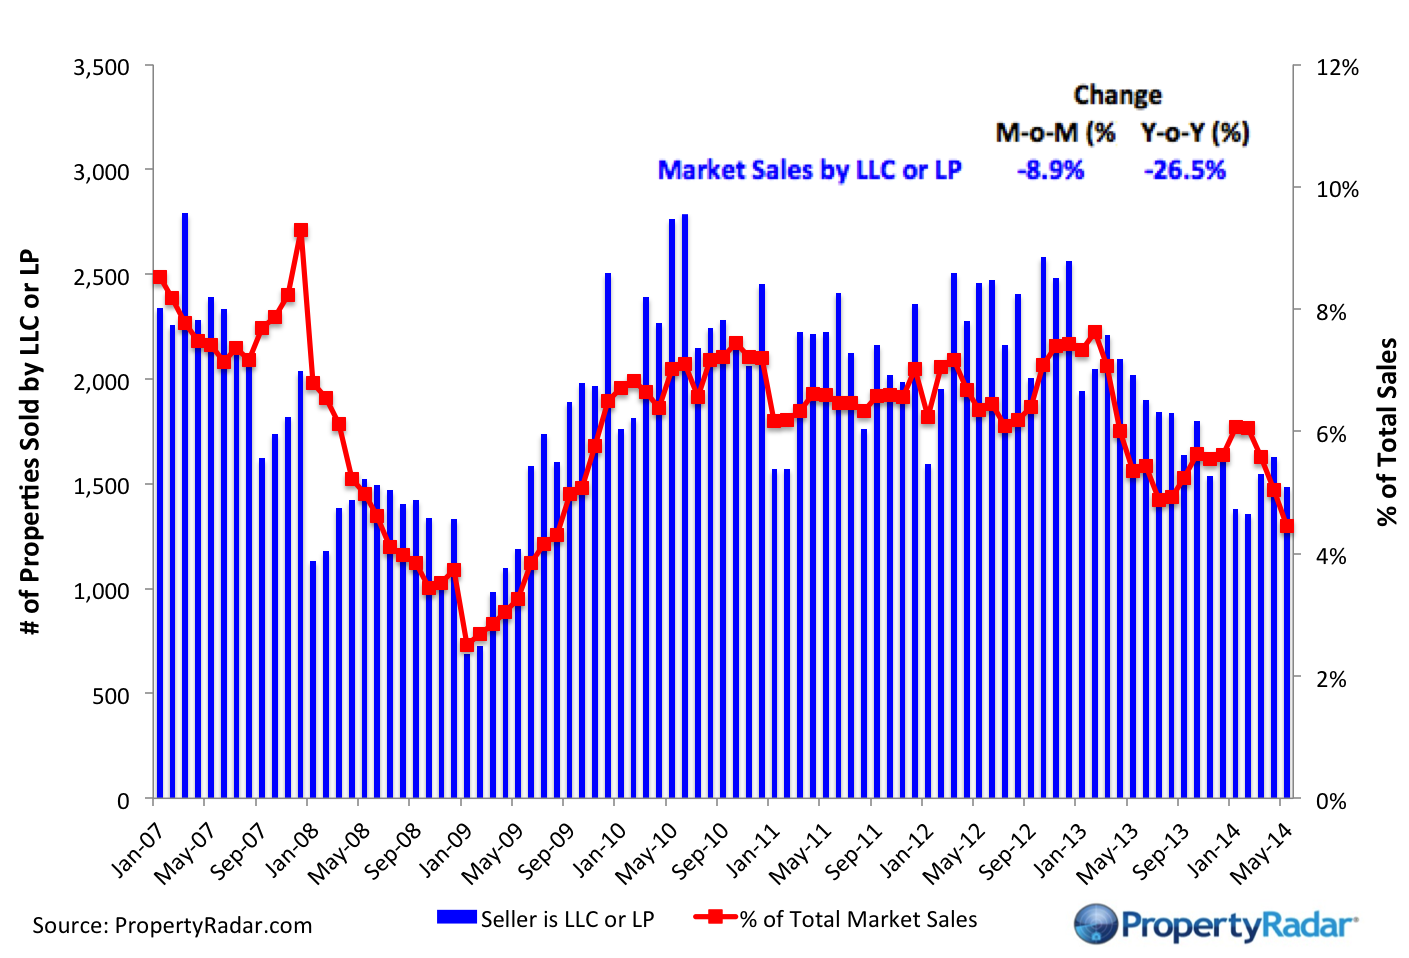
Market Sales by LLCs and LPs - The blue bars (right axis) illustrate market sales by LLCs and LPs of single-family residences and condominiums by month. The red line graph (left axis) illustrates sales as a percentage of total sales by month.
Trustee Sale Purchases by LLCs and LPs
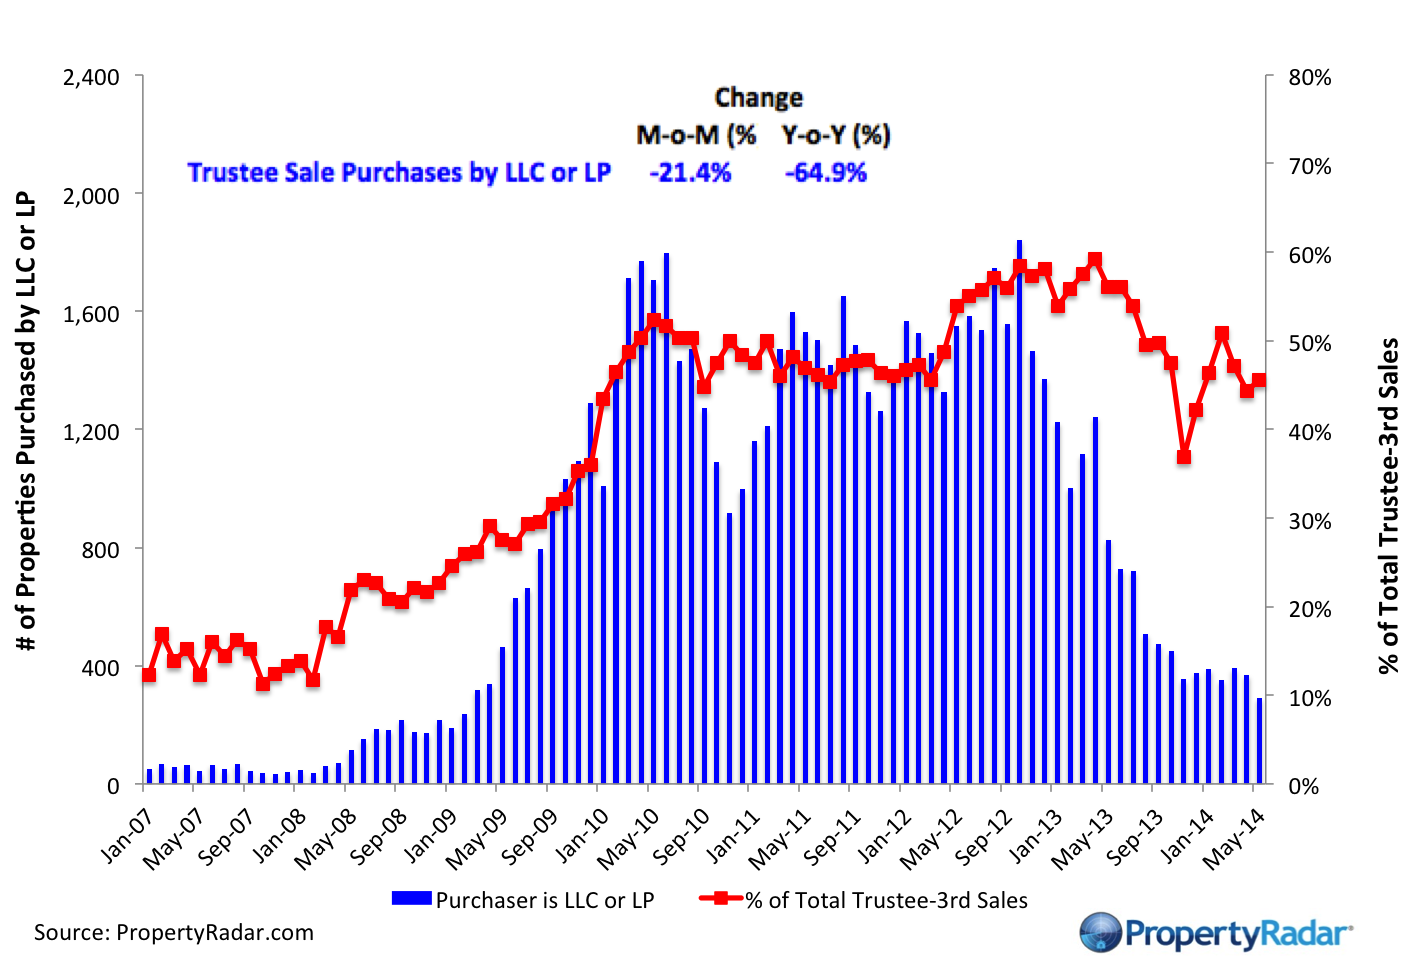
Trustee Sale Purchases by LLCs and LPs - The blue bars (right axis) illustrate trustee sale purchases (foreclosure sales) of single-family residences and condominiums by LLCs and LPs from 2007 to current. The red line graph (left axis) illustrates purchases as a percentage of total trustee sales by month.
Foreclosure Notices and Sales
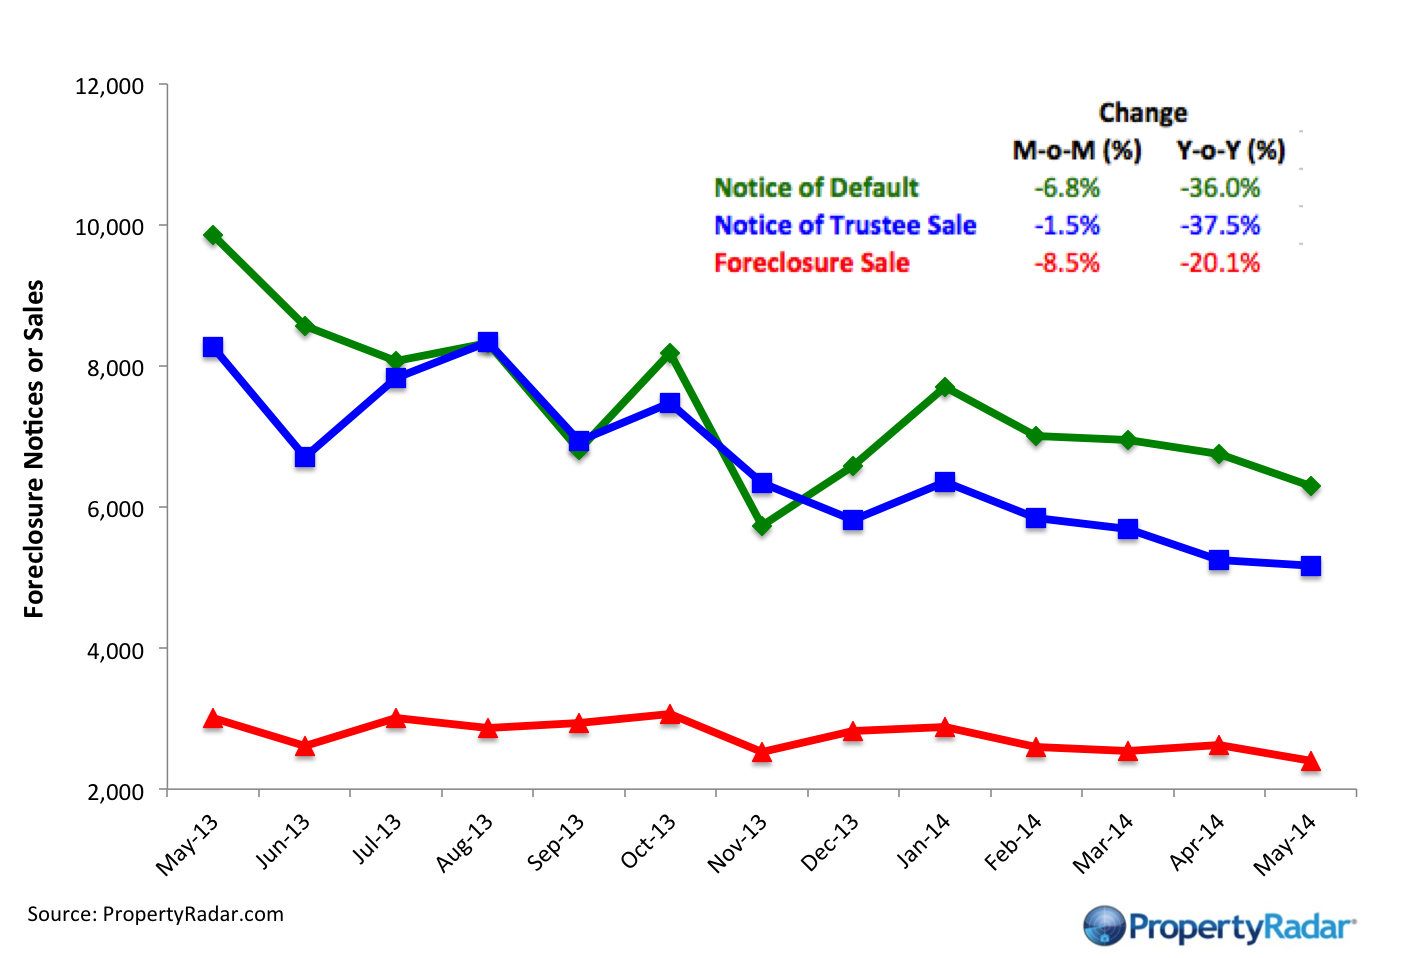
Foreclosure Notices and Sales - Properties that have received foreclosure notices — Notice of Default (green) or Notice of Trustee Sale (blue) — or have been sold at a foreclosure auction (red) by month.
Foreclosure Inventories
Foreclosure Inventory - Preforeclosure inventory estimates the number of properties that have had a Notice of Default filed against them but have not been Scheduled for Sale, by month. Scheduled for Sale inventory represents properties that have had a Notice of Trustee Sale filed but have not yet been sold or had the sale cancelled, by month. Bank-Owned (REO) inventory means properties sold Back to the Bank at the trustee sale and the bank has not resold to another party, by month.
Real Property Report Methodology
California real estate data presented by PropertyRadar, including analysis, charts, and graphs, is based upon public county records and daily trustee sale (foreclosure auction) results. Items are reported as of the date the event occurred or was recorded with the California county. If a county has not reported complete data by the publication date, we may estimate the missing data, though only if the missing data is believed to be 10 percent or less of all reported data.