
California Property Reports
April Home Sales Gain 20 Percent For the Month BUT Year-to-Date Sales Lowest Since 2008
California single-family home and condominium sales in April 2014 were up 20.0 percent for the month but were down 13.3 percent from April 2013. Despite April gains, year-to-date sales volume was at its lowest level since 2008.
For the month, both distressed and non-distressed property sales posted gains. April 2014 distressed property sales gained 13.1 percent from March, while non-distressed property sales were up 21.8 percent.
“Despite back-to-back double-digit sales gains in both March and April, total sales volume since January continues to lag sales in 2013,” said Madeline Schnapp, Director of Economic Research for PropertyRadar. “In fact, what is surprising to me is that year-to-date sales are the lowest since 2008.”
The April 2014 median price of a California home hit its highest level in six years, rising 7,500 dollars, or 2.0 percent, to 376,500 dollars from 369,000 dollars in March. On a year-ago basis, median home prices jumped 14.1 percent. Driving the month-over-month price increase in April was a 21.8 percent increase in the sales volume of higher-priced non-distressed properties.
“Despite lower sales volume, the median price of a California home continues to march higher,” said Schnapp. “The rise in median home prices is being driven by the change in mix between the sales of distressed properties versus sales of non-distressed properties. Higher priced non-distressed property sales now dominate monthly sales numbers, so it should come as no surprise that median prices are up.”
In other California housing news:
- Underwater homeowners continue to impart negative headwinds to the California real estate recovery. In April, nearly 1.2 million California homeowners, or 13.5 percent remain underwater.
- Institutional Investor LLC and LP purchases gained 7.0 percent for the month but are down 36.9 percent from April 2013. Purchases are up 19.3 percent since January 2014. Despite year-to-date gains, LLC and LP purchases are down 42.2 percent from their December 2012 peak.
- For a second consecutive month, cash sales posted double-digit gains, up 12.3 percent for the month but down 21.4 percent on a year ago basis. Since the beginning of the year, cash sales are up 33.1.
- Flip sales gained 7.4 percent for the month but were down 21.5 percent for the year.
- Foreclosure sales gained 2.9 percent in April from March but are down 32.4 percent year-over-year. The April gain is statistically insignificant, likely due to the extra weekday in April compared to March.
- Foreclosure inventories continue to trend gradually lower, down 1.1 percent for the month and down 17.6 percent for the year.
“While most real estate analysts are forecasting a robust real estate recovery for the rest of 2014, our data suggests anemic sales growth,” said Schnapp. “Elevated negative equity, high prices and low inventory are depressing sales volumes and crowding out potential buyers.”
Home Sales
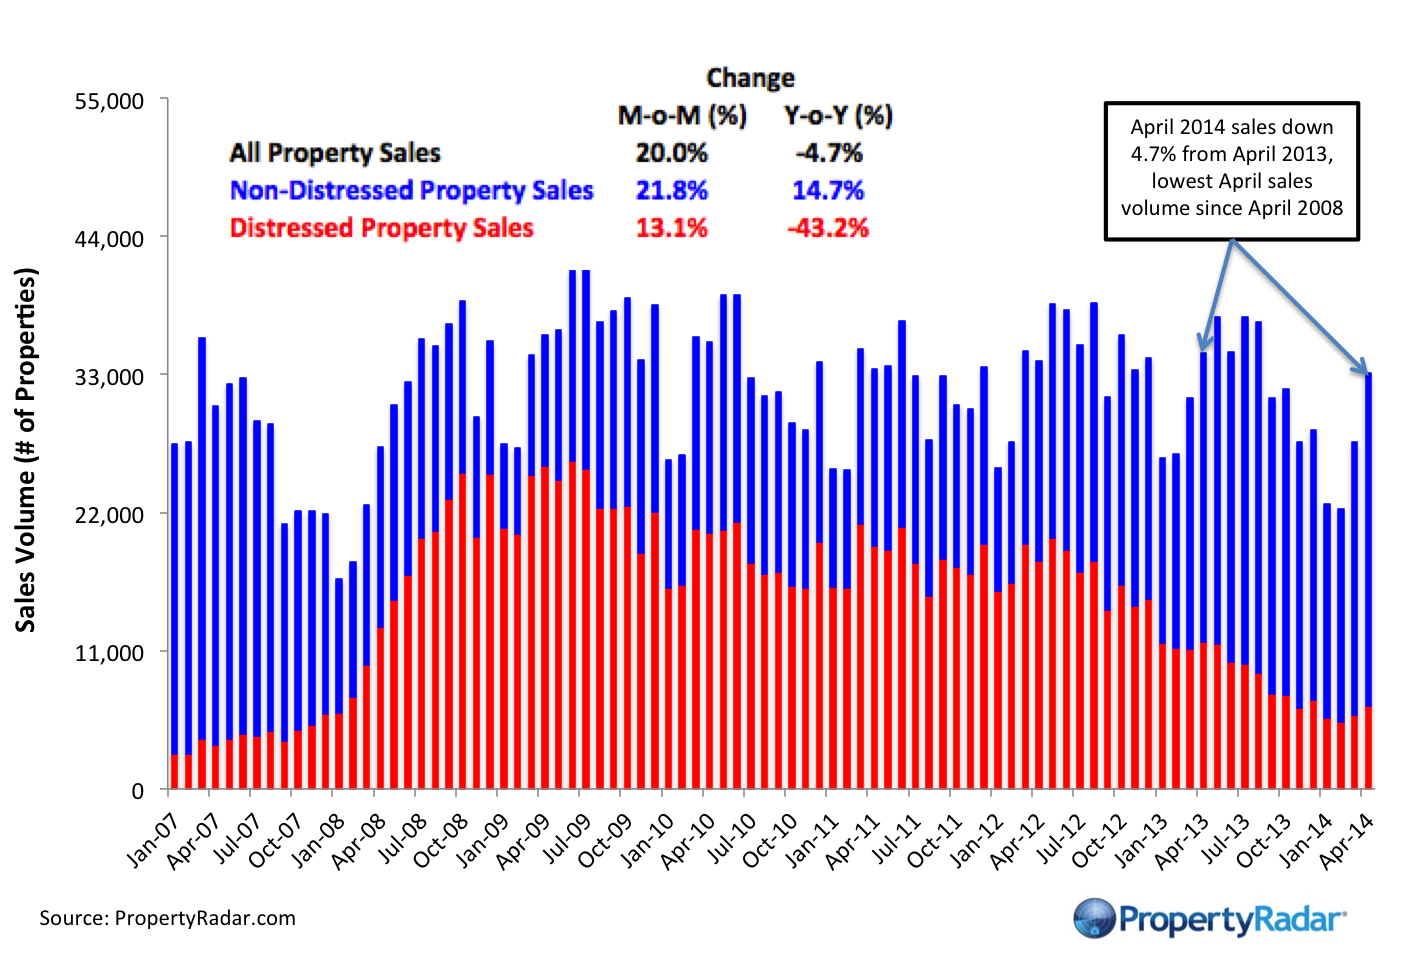
Home Sales - Single-family residence and condominium sales by month from 2007 to current divided into distressed and non-distressed sales. Distressed sales are the sum of short sales, where the home is sold for less than the amount owed, and REO sales, where banks resell homes that they took ownership of after foreclosure. All other sales are considered non-distressed.
Year-over-Year Home Sales
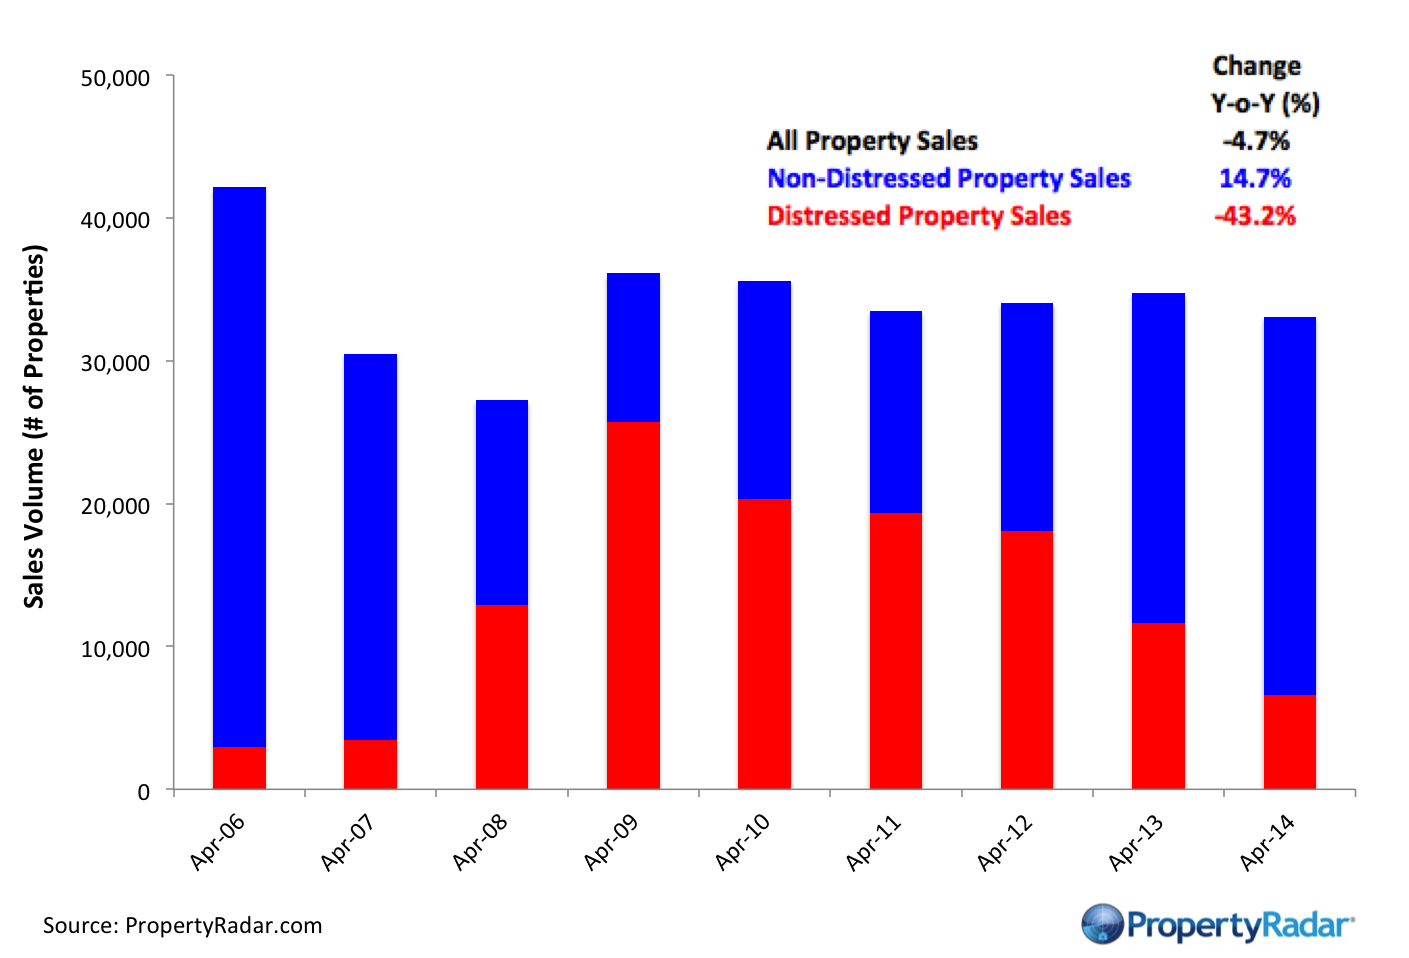
Year-over-Year Home Sales - Single-family residences and condominiums sold during the same month for the current year and prior years divided into distressed and non-distressed sales.
Median Sales Prices vs. Sales Volume
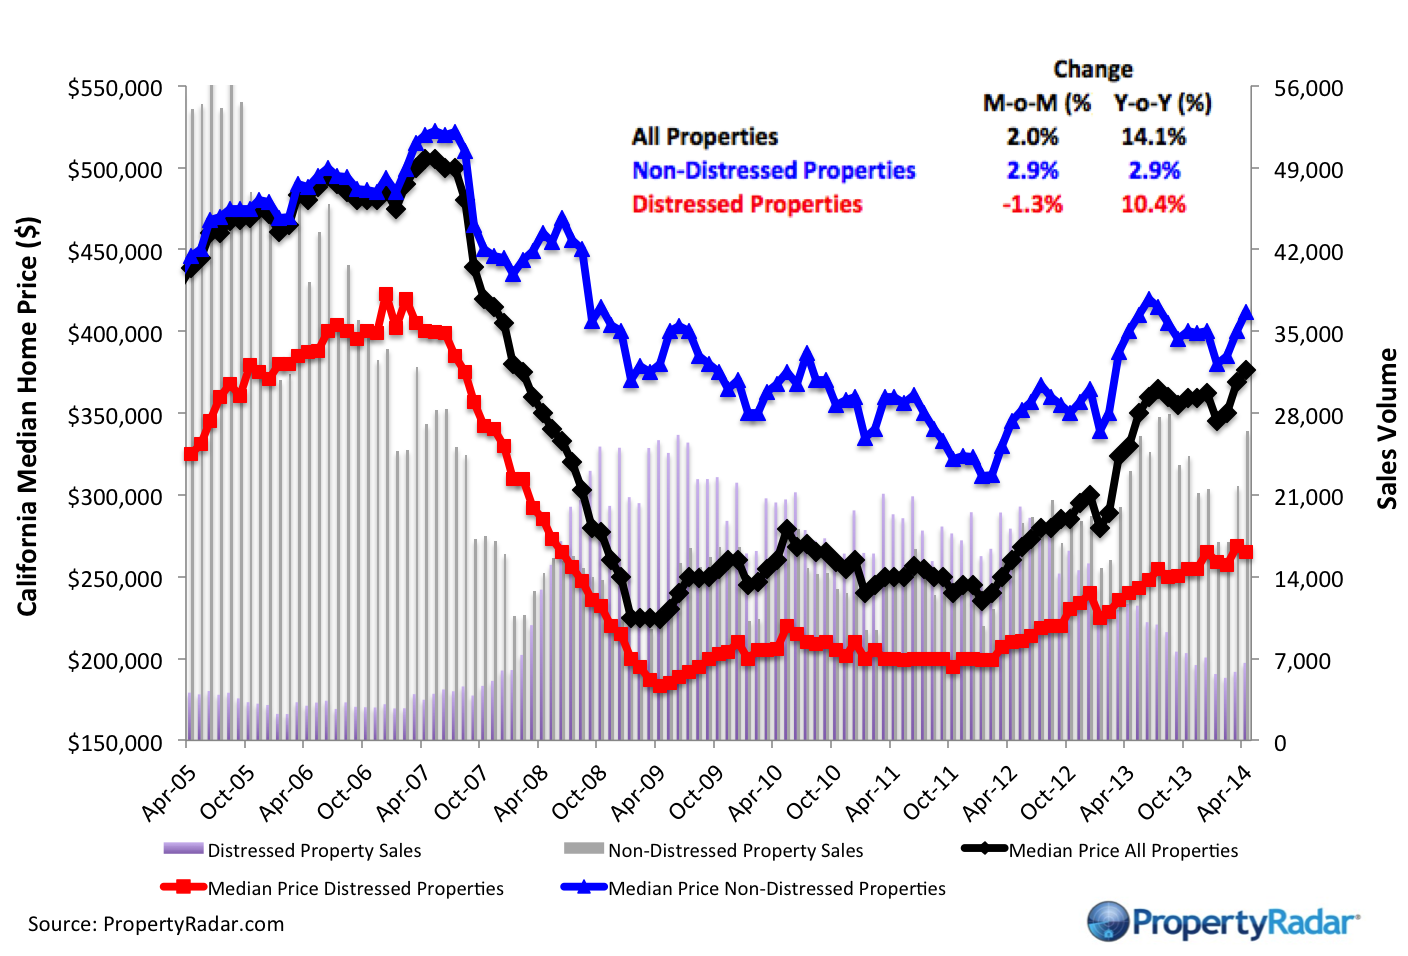
Median Sales Price vs. Sales Volume - Median sales price (left axis) of a California single family home versus sales volume (right axis), by month from 2005 to current. Median sales prices are divided into three categories: All single-family homes (blue line), distressed properties (red line), and non-distressed properties (green line). Monthly sales volume (right axis) are illustrated as gray and lavender bars. The gray bars are distressed sales and the lavender bars are non-distressed sales.
California Homeowner Equity
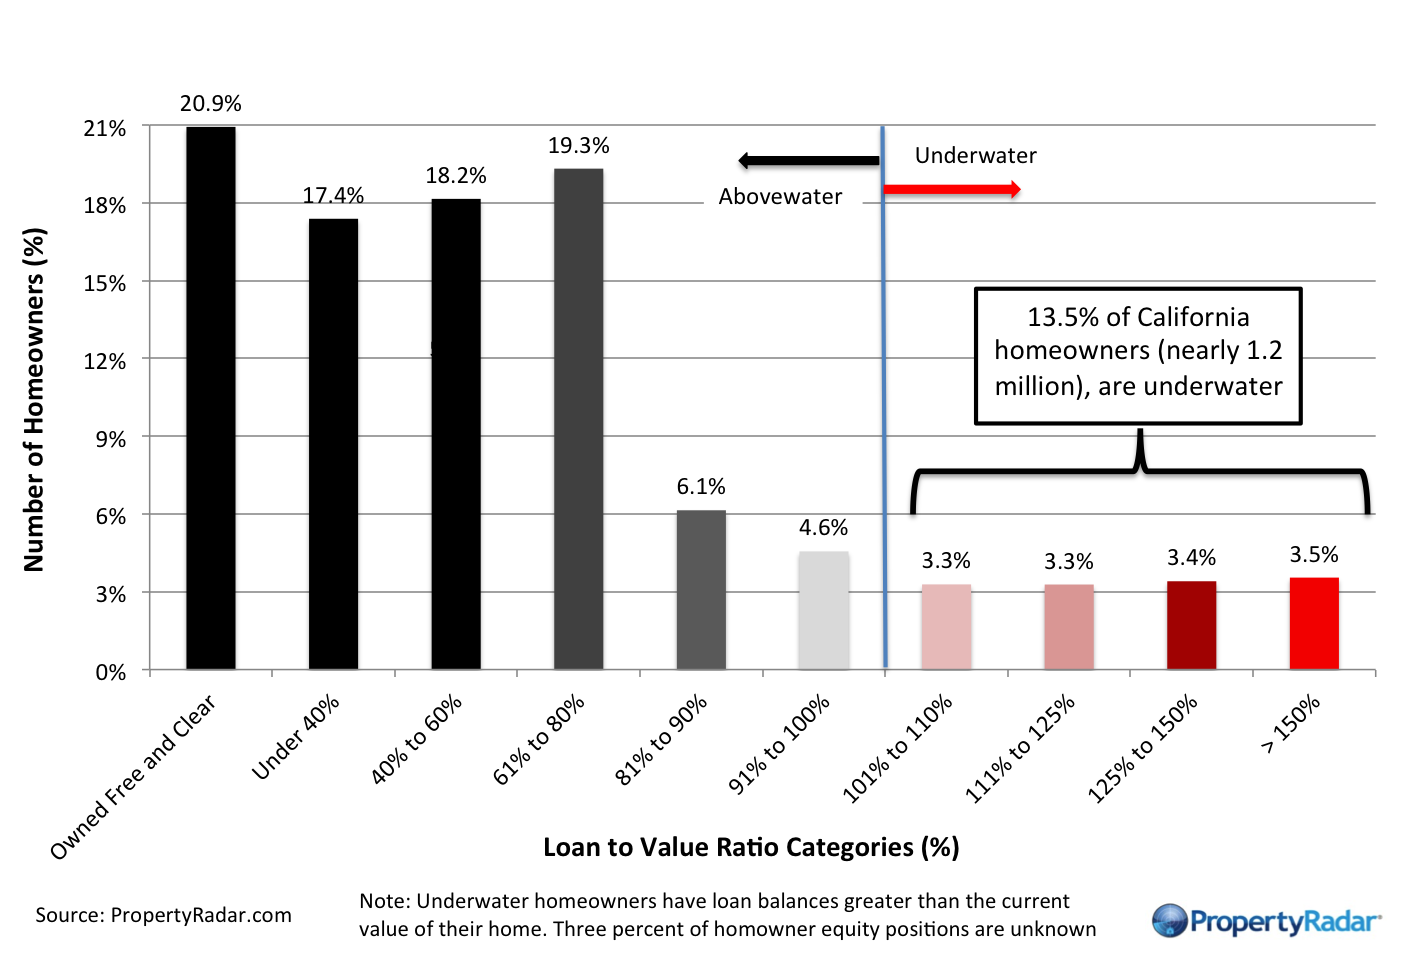
California Home Owner Equity - A model estimate of California homeowners segregated into various categories of levels of homeowner equity for a given month. Homeowner numbers represent a percentage of total California homeowners.
Cash Sales
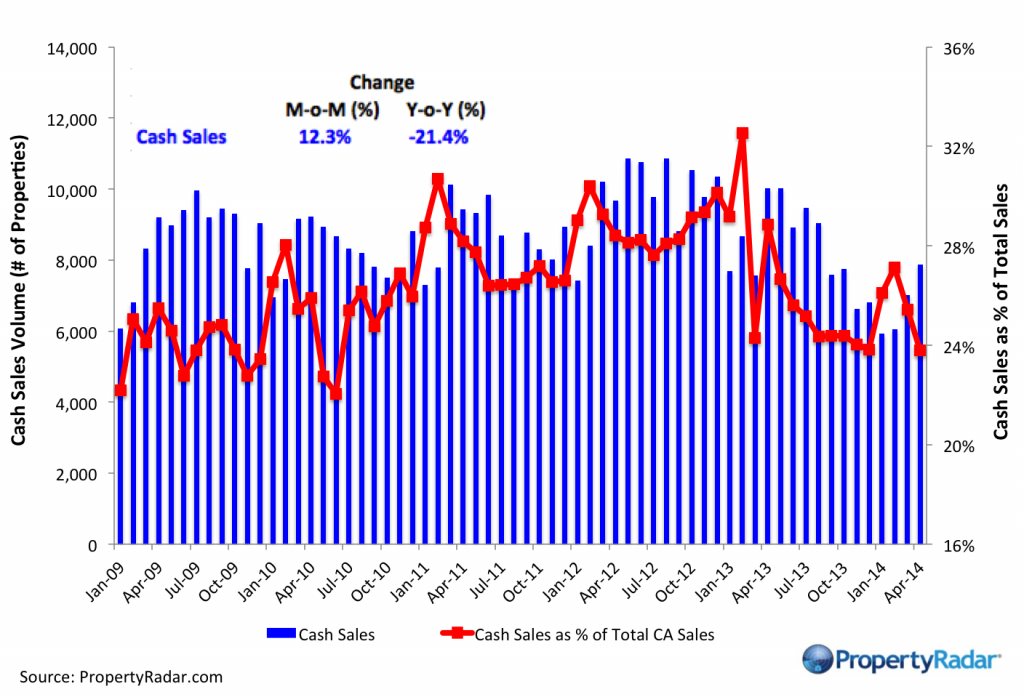
Cash Sales - The blue bars (right axis) illustrate cash sales of single-family residences and condominiums by month. The red line (left axis) illustrates cash sales as a percentage of total sales by month.
Flipping
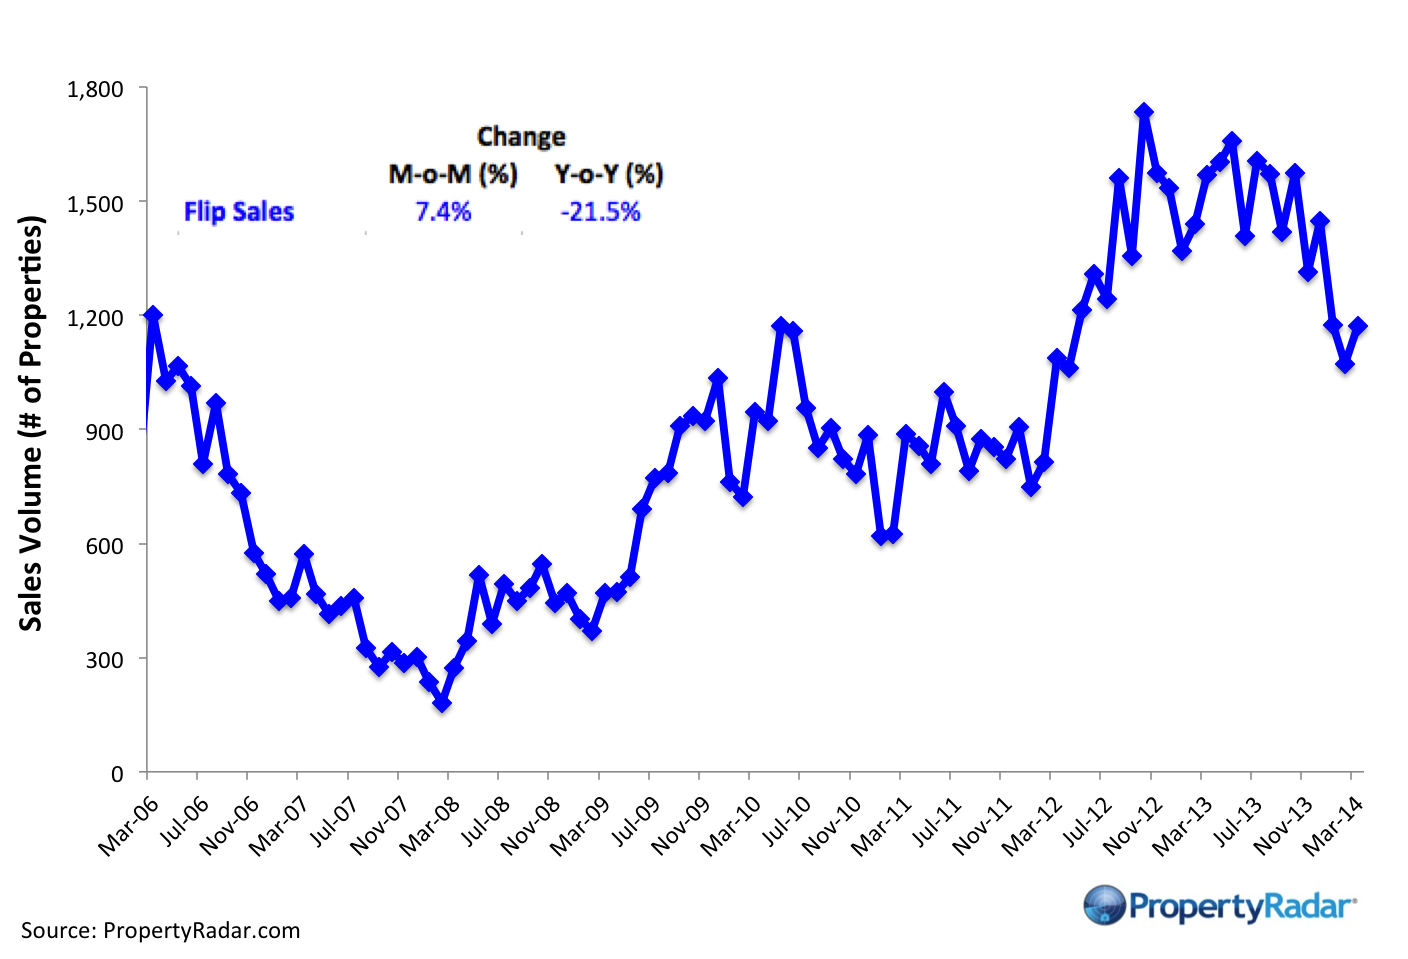
Flipping – The number of single-family residences and condominiums resold within six months.
Market Purchases by LLCs and LPs
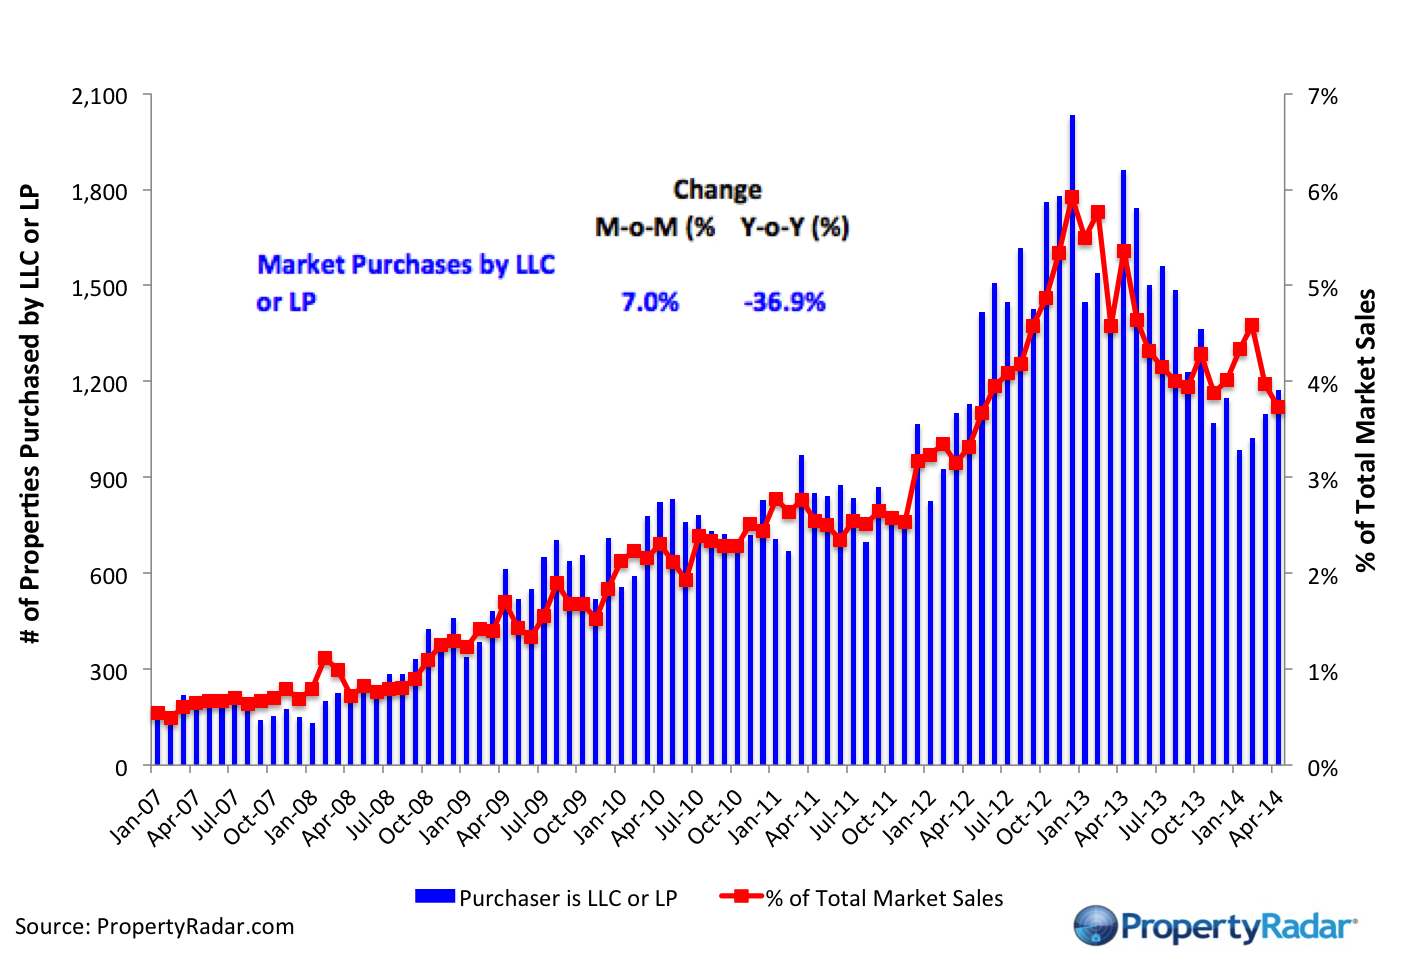
Market Purchases by LLCs and LPs - The blue bars (right axis) illustrate market purchases of single-family residences and condominiums by LLCs and LPs from 2007 to current. The red line graph (left axis) illustrates LLC and LP purchases as a percentage of total sales by month.
Market Sales by LLCs and LPs
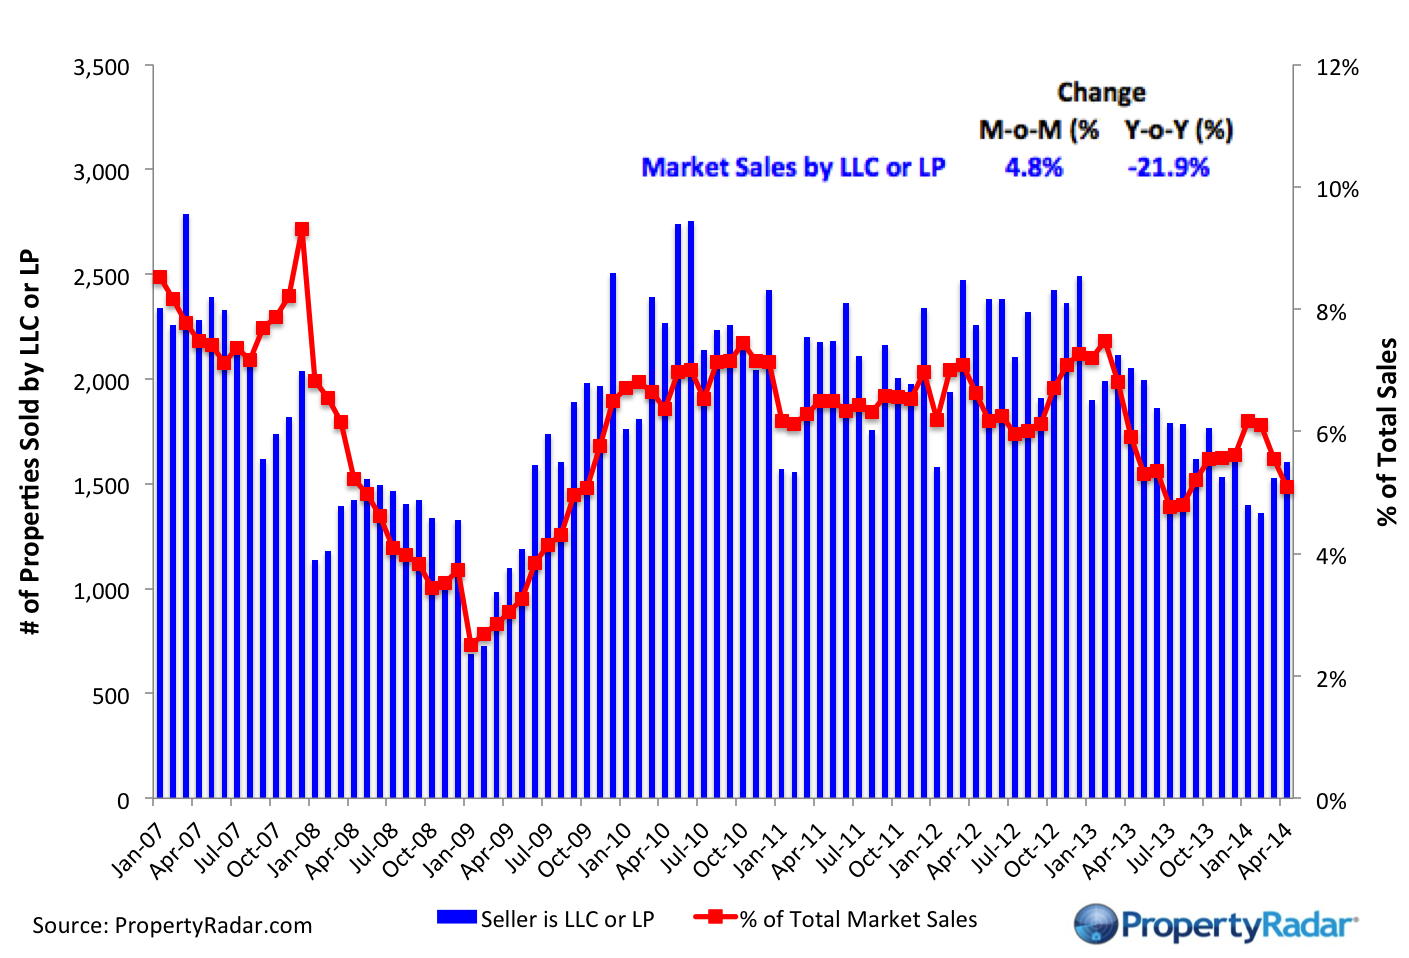
Market Sales by LLCs and LPs - The blue bars (right axis) illustrate market sales by LLCs and LPs of single-family residences and condominiums by month. The red line graph (left axis) illustrates sales as a percentage of total sales by month.
Trustee Sale Purchases by LLCs and LPs
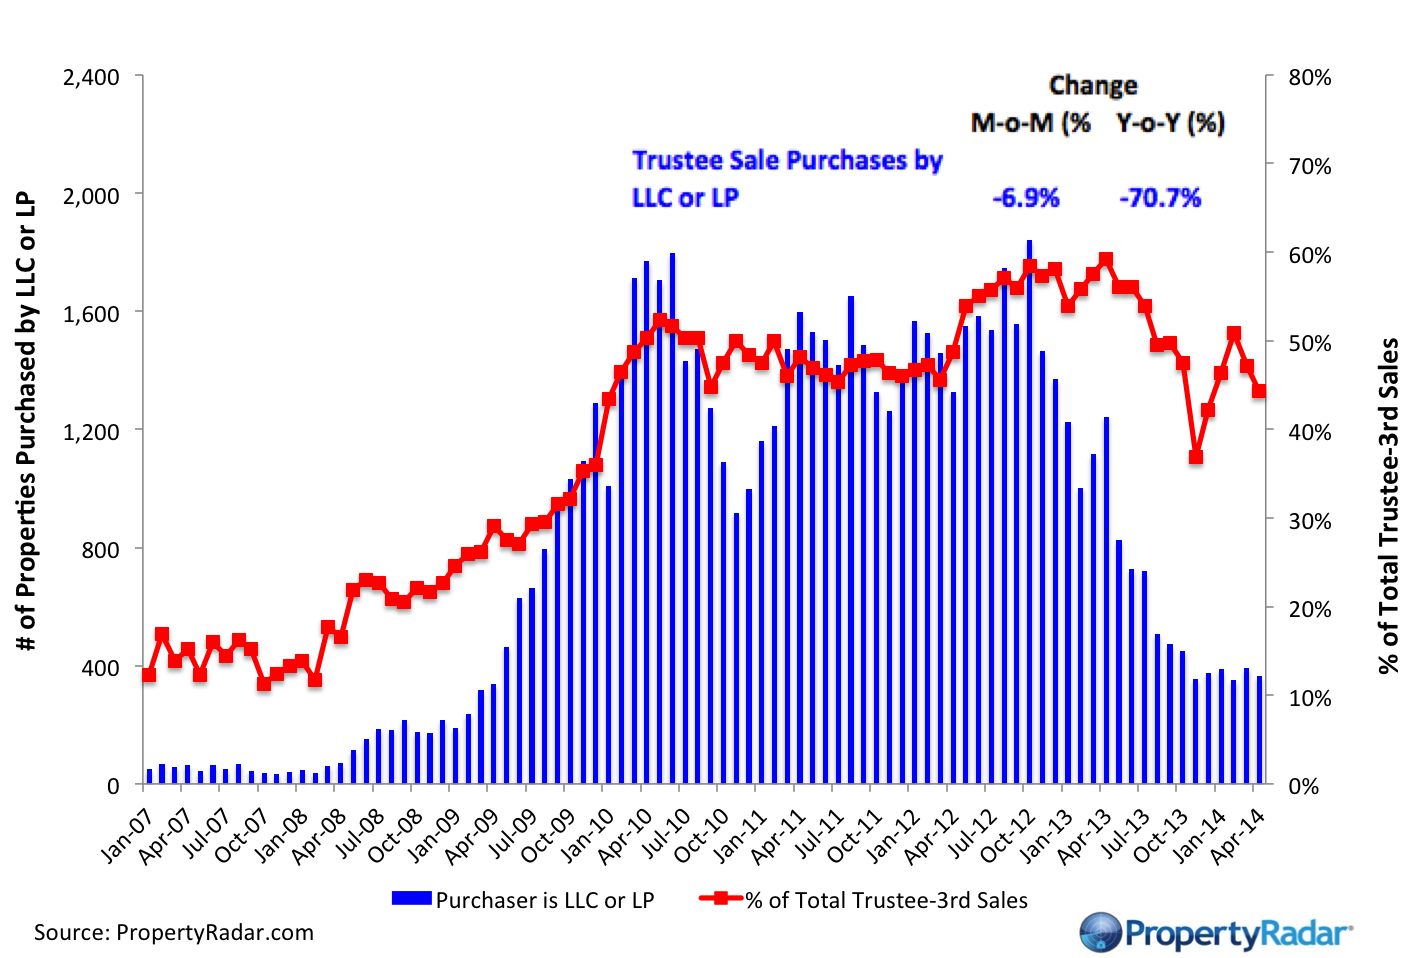
Trustee Sale Purchases by LLCs and LPs - The blue bars (right axis) illustrate trustee sale purchases (foreclosure sales) of single-family residences and condominiums by LLCs and LPs from 2007 to current. The red line graph (left axis) illustrates purchases as a percentage of total trustee sales by month.
Foreclosure Notices and Sales
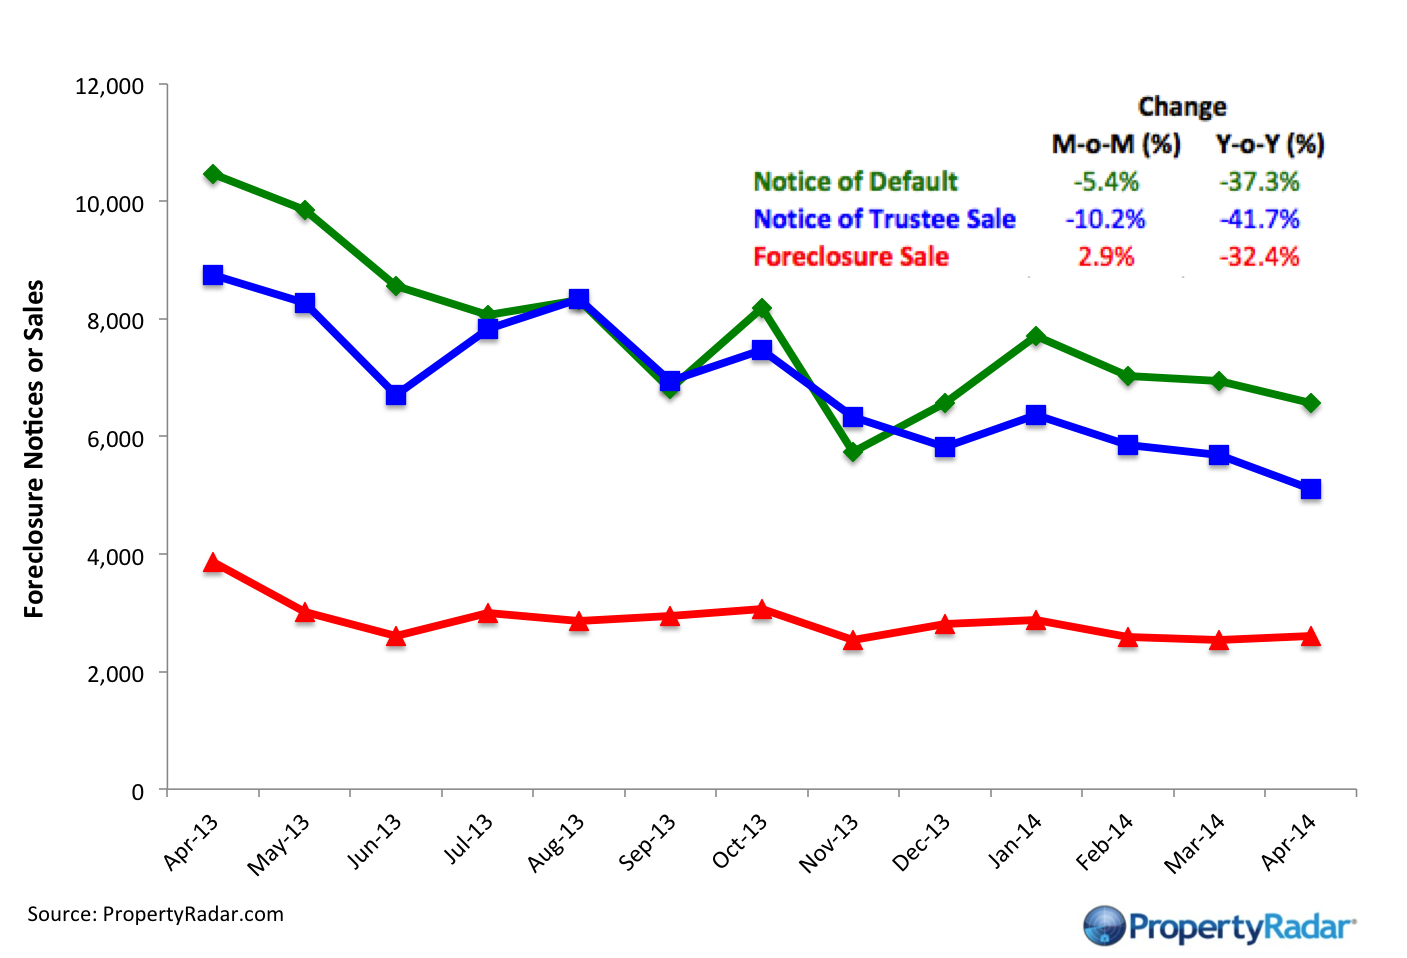
Foreclosure Notices and Sales - Properties that have received foreclosure notices — Notice of Default (green) or Notice of Trustee Sale (blue) — or have been sold at a foreclosure auction (red) by month.
Foreclosure Inventories
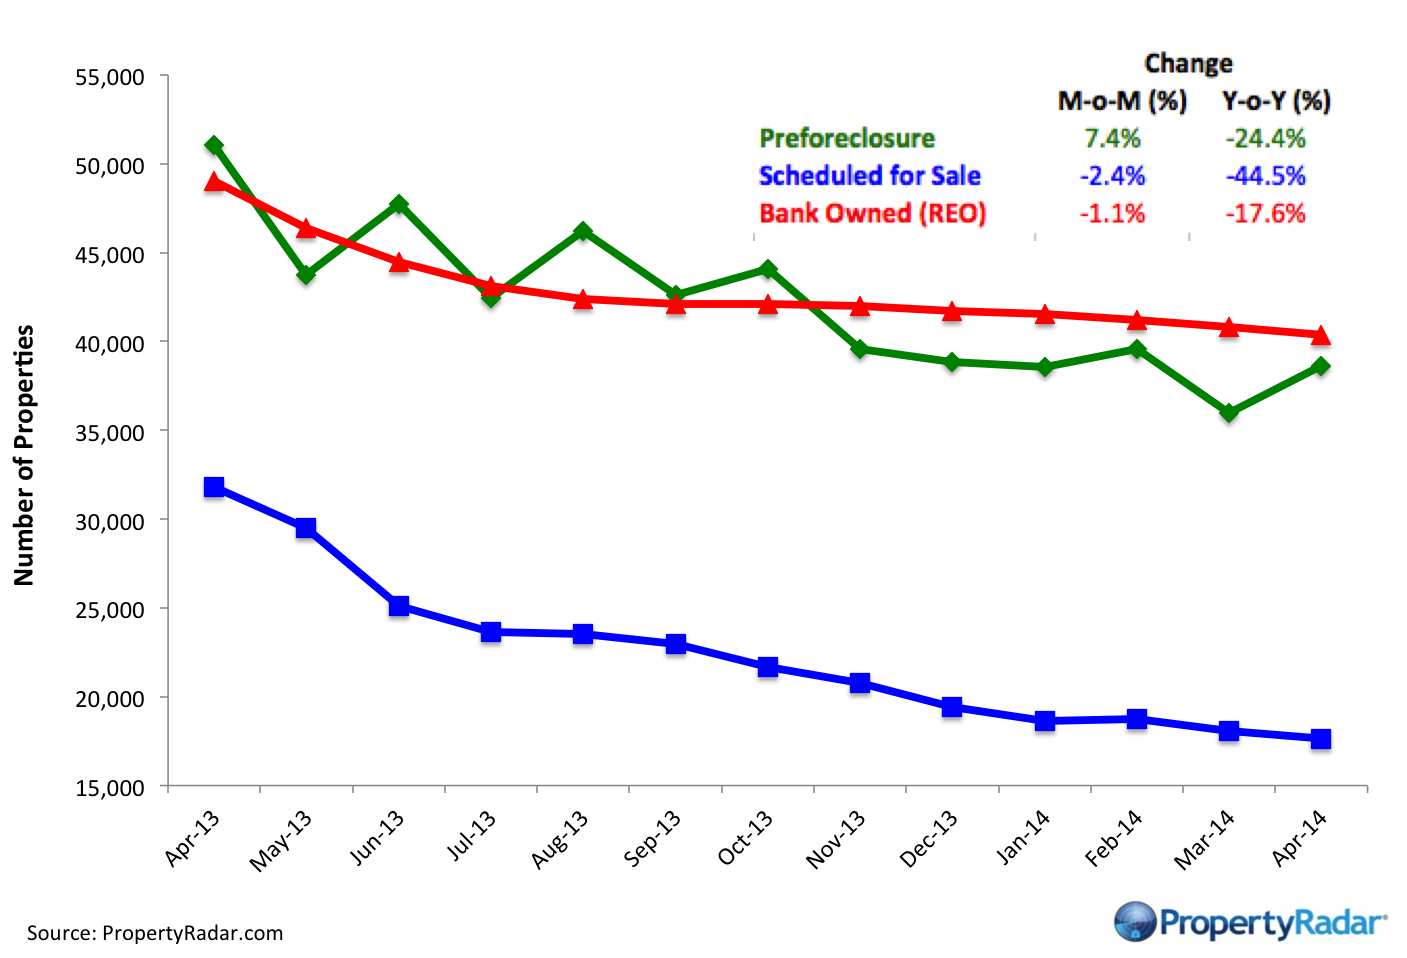
Foreclosure Inventory - Preforeclosure inventory estimates the number of properties that have had a Notice of Default filed against them but have not been Scheduled for Sale, by month. Scheduled for Sale inventory represents properties that have had a Notice of Trustee Sale filed but have not yet been sold or had the sale canceled, by month. Bank-Owned (REO) inventory means properties sold Back to the Bank at the trustee sale and the bank has not resold to another party, by month.
Real Property Report Methodology
California real estate data presented by PropertyRadar, including analysis, charts, and graphs, is based upon public county records and daily trustee sale (foreclosure auction) results. Items are reported as of the date the event occurred or was recorded with the California county. If a county has not reported complete data by the publication date, we may estimate the missing data, though only if the missing data is believed to be 10 percent or less of all reported data.