
California Property Reports
Market Activity
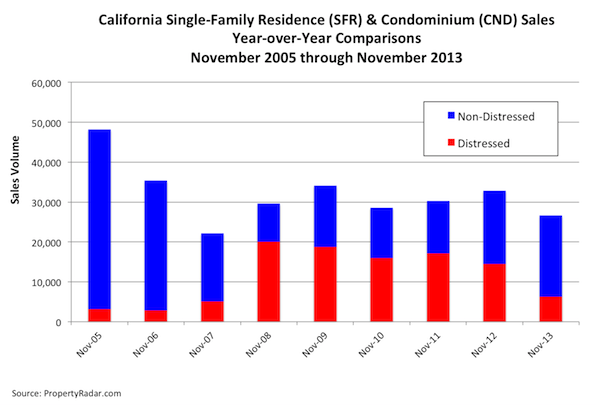
California single-family home and condominium sales fell 11.5 percent in November from October, and were down 14.3 percent from a year ago.
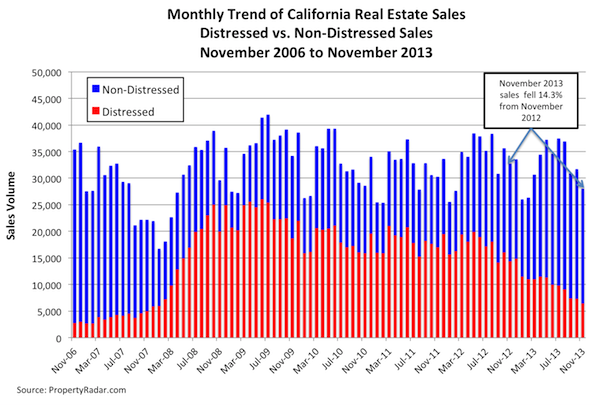
To get a clearer picture of current real estate sales trends and to eliminate seasonal factors, we compare November 2013 property sales to November sales in prior years. Dividing sales into their distressed and non-distressed components, non-distressed sales enjoyed a healthy year-over-year increase of 17.9 percent, but a 54.8 percent plunge in non-distressed property sales triggered an 11.5 percent decline in overall year-over-year sales. Despite November's decline in distressed property sales, they still accounted for 23.4 percent of total sales, which remains historically high. Distressed property sales, as a percent of total sales, are much higher in counties away from the coastal areas. Seven of the eight counties with the highest percentage of distressed property sales - Fresno, Kern, San Bernardino, San Joaquin, Solano, Stanislaus, and Tulare - are in non-coastal areas. In those counties, distressed property sales represented more than than 30 percent of sales; Solano County was highest at 39.4 percent.
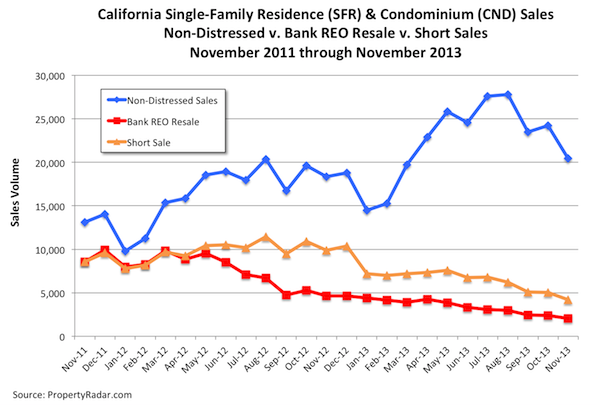
Dividing distressed property sales into short sales and bank REO resales can provide a better understanding of underlying trends. Short sales declined 16.8 percent in November and are down 57.6 percent from a year ago. Bank REO resales are down 14.5 percent for the month and are down 56.0 percent year-over-year.
Homeowner Equity
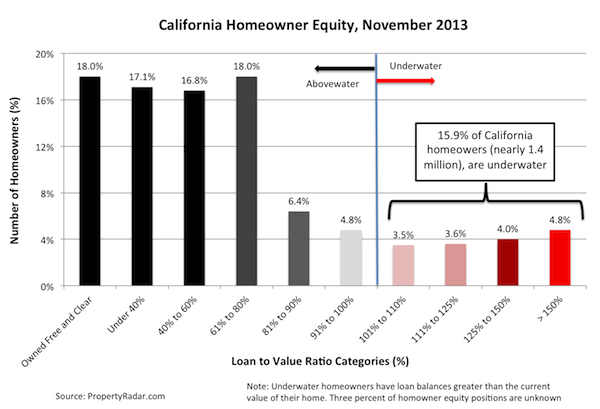
The steady rise in home prices since January 2012 has helped thousands of previously underwater homeowners in California shift to positive-equity status, so they can refinance or sell their homes. In November, the number of homeowners with more than 10 percent equity in their homes increased by 0.8 percent, or 41,000 homeowners; in the past four months that number has increased by 4.3 percent, or approximately 207,000. Since August, the number of homeowners who are moderately to severely underwater has fallen by 12.9 percent, or approximately 160,000.
Despite the improvement, large numbers of underwater homeowners remain a drag on the California real estate market. In November, nearly 1.4 million (15.9 percent) of California's 8.6 million homeowners were underwater while more than 413,000 (4.8 percent) were barely above water (less than 10 percent equity in their homes). Since costs to resell a home are as much as 10 percent of a home's sale price, these homeowners are effectively underwater. All told, 20.7 percent of homeowners (just under 1.8 million) are underwater or barely above water - and effectively shut out of the California real estate market.
Several of California's largest counties continue to struggle with much higher levels of negative equity. In Fresno, Kern, Merced, Solano, San Joaquin, and Stanislaus counties, 27 to 32 percent of homeowners, or one in three, are moderately to severely underwater.
Median Prices
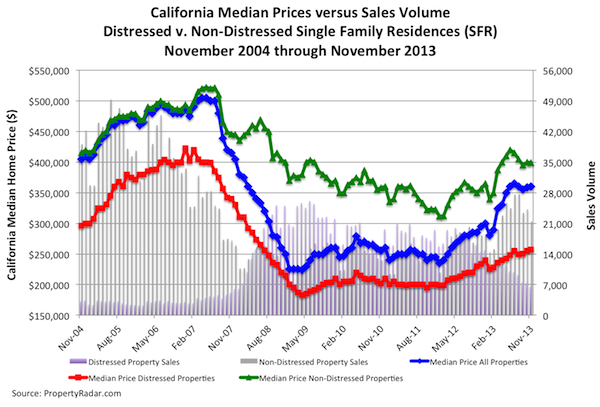
The median sale price of a California home was nearly unchanged in November 2013, gaining $1,000, or 0.3 percent, to $360,000 from $359,000 in October. Median prices have hovered near $360,000 since June. Rapid monthly home price increases, that typified the California real estate market earlier this year, appear to have slowed or reversed course in response to a 107-basis-point increase in mortgage interest rates in May. On a year-over-year basis, median prices increased 22.0 percent from $295,000 to $360,000.
Rapid changes in the mix of distressed and non-distressed property sales from 2012 to 2013 continue to influence the year-over-year change in median prices. Distressed property sales decreased from 44.3 percent of total sales in November 2012 to 23.4 percent in November 2013The following graph highlights median sales price trends from January 2004 to November 2013.
Aggregate single-family home median sales prices are shown in blue, and distressed and non-distressed median prices are shown in red and green, respectively.
Cash Sales
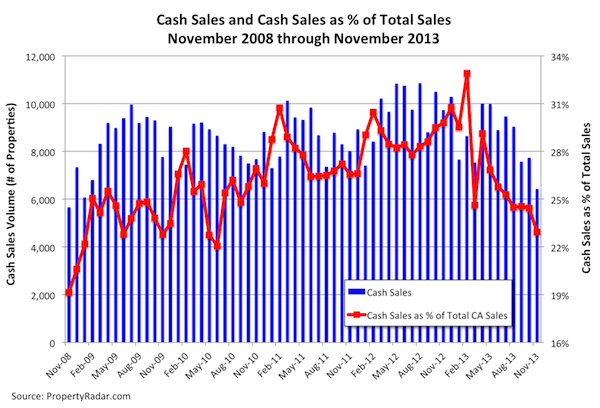
In November 2013, cash sales represented 22.9 percent of total sales, down 1.5 percentage points from 24.4 percent in October. Taking a longer-term view, cash sales as a percent of sales oscillated between 28 percent and 31 percent from January 2012 through January 2013. They peaked at 33.0 percent in February 2013 and have been below 25 percent since August 2013. Despite recent declines, from a historic perspective, cash sales remain high and are an important part of the real estate marketplace.
Flipping
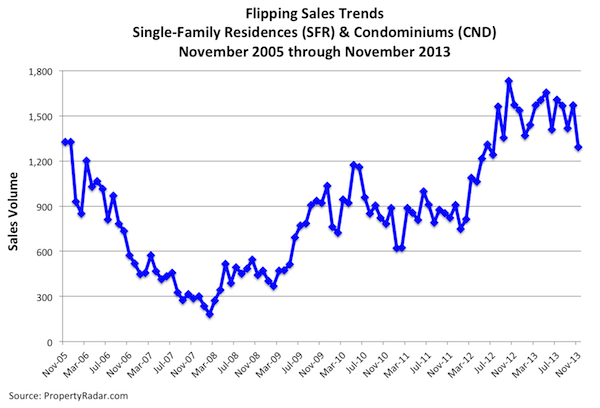
November 2013 flipping (reselling a property within six months) fell 17.8 percent from October to its lowest level since July 2012, and was down 18.0 percent from a year ago. Flips represented 4.8 percent of total sales in November, down from 5.0 percent in October.
Taking a longer-term view, in 2011, as housing prices trended sideways, flipping was basically flat, ranging from 2.5 percent of sales in January to 2.7 percent in December 2011. In 2012, flipping as a percent of sales began to increase, rising from 2.9 percent in January 2012 and peaking in February 2013 at 5.5 percent. Flipping retreated from February 2013 to June 2013, reaching an interim bottom of 4.1 percent of sales.
In November, within the 26 largest California counties, flipping as a percent of sales was greatest in Los Angeles, Merced, Orange, Sacramento, San Bernardino, San Diego, and San Joaquin counties; Merced County was the highest at 8.8 percent of sales.
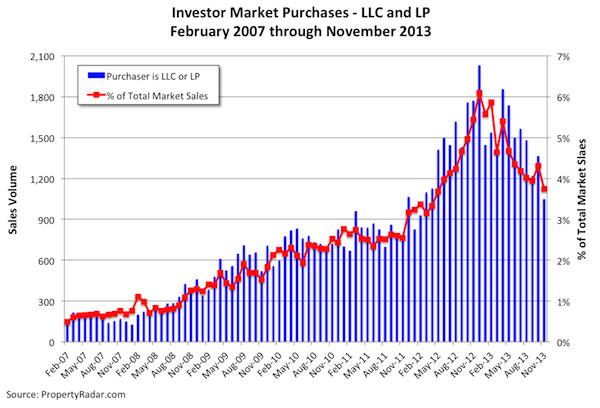
Investor (LLC and LP) Purchases
After a one-month bounce in October, investor purchases resumed their downward march in November 2013, falling 23.1 percent for the month. Investor purchases are defined as a market or third party purchase at a trustee sale by a limited liability corporation (LLC) or a limited partnership (LP). In general, investor purchases have been trending lower since peaking in December 2012 and are now 48.3 percent below the peak. This is being driven primarily by the increase in purchase prices. As prices rise, the potential return on investment (ROI) for holding properties as rentals decreases, making homes less attractive to investors.
Foreclosures
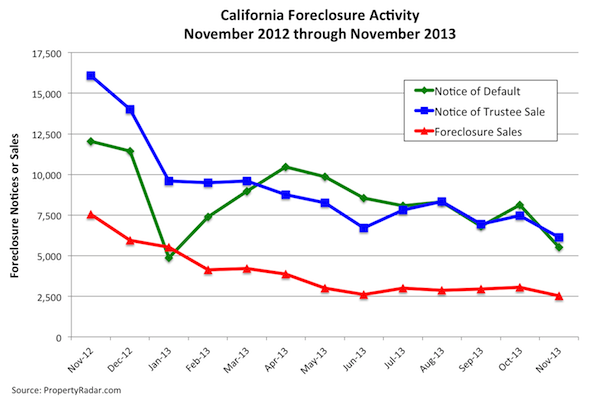
November California foreclosures - Notices of Default, Notices of Trustee Sale, and Foreclosure Sales - declined in November to its lowest levels in our records dating back to January 2007. The holidays likely were a contributing factor
.After trending mostly sideways since July, November California Notices of Default tumbled 32.0 percent for the month and are down 54.0 percent in the past 12 months. Similarly, Notices of Trustee Sale fell 17.8 percent and are down 61.9 percent for the year. Foreclosure sales declined 17.7 percent for the month and sank 66.5 percent for the year.
Madeline's Take - Director of Economic Research, PropertyRadar
A couple of interesting trends caught my eye this past month that are worth highlighting. First, November 2013 California property sales tumbled 14.3 percent from November 2012, confirming that the 107-basis-point increase in mortgage interest rates since May has definitely taken a bite out of the California real estate market. In addition, the double-digit monthly increases in median home prices have stopped for the time being and for-sale inventory is on the rise. While buyers are happy to see the new inventory and slowdown in price gains, the underlying cause is far from healthy and due to ongoing uncertainty over the trajectory of mortgage interest rates. The blame for the uncertainty rests squarely at the feet of the Federal Reserve that continues to dither about the precise timing of unwinding (tapering) its QE3 bond purchase program.
Many in the financial industry believe that the Federal Reserve will announce their tapering plans as early as Tuesday, December 17. Others believe the Federal Reserve will wait until sometime early next year to announce its tapering plans. In our opinion, mortgage interest rates have already priced in the first round of tapering. What the market needs right now is clarity so that real estate professionals, buyers, and sellers can plan for the future.
Sean's Take - Founder/CEO, PropertyRadar
I was recently asked if price increases would soon solve the negative equity problem. I reminded the state senator, that if we had price increases sufficient to pull everyone out from underwater, we'd be back in a serious bubble. Without significant increases in household income, getting back to the home prices we saw in 2007 would only help those smart enough to sell when we got there. For the rest, it would be a disaster. So to those hoping for higher prices, or disappointed that price increases have slowed, I'd caution you to be careful what you wish for. If you really want to see sustainable home price increases, wish for a robust and growing economy that allows incomes to rise. More importantly, if you're a real estate professional, don't forget the 1.4 million underwater homeowners that need your help. Many of those homeowners don't realize they can do a short sale, and most don't realize they may be able to immediately buy another home. Let's knock on every one of those doors and make sure they know their options. There is no bigger opportunity in 2014. We can help you find them.
Real Property Report Methodology
California real estate data presented by PropertyRadar, including analysis, charts, and graphs, is based upon public county records and daily trustee sale (foreclosure auction) results. Items are reported as of the date the event occurred or was recorded with the California county. If a county has not reported complete data by the publication date, we may estimate the missing data, though only if the missing data is believed to be 10 percent or less of all reported data.