
California Property Reports
Market Activity
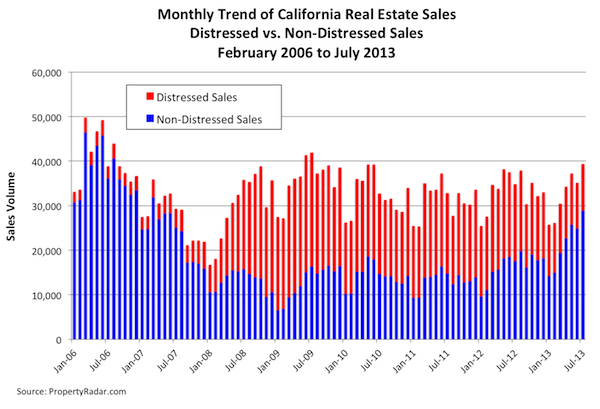
July 2013 California single-family home (SFR) and condominium (CND) sales (distressed and non-distressed) gained 12.1 percent from June and rose 12.9 percent in the past 12 months (y-o-y). A sharp increase in sales of non-distressed properties drove the jump in July sales.
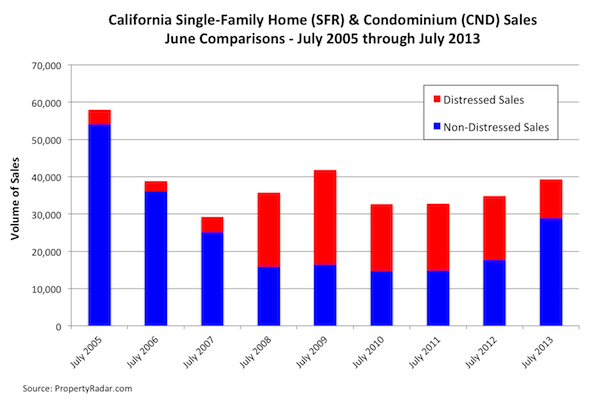
To get a clearer picture of current real estate sales trends and to eliminate seasonal factors, we compare July 2013 distressed and non-distressed property sales to July sales in prior years. With the exception of the temporary bounce in July 2009 sales from the First-Time Homebuyer Tax Credit, July 2013 sales were the highest since July 2006. Dividing sales into their distressed and non-distressed components, distressed property sales fell 39.4 percent in the past 12 months, while non-distressed property sales jumped 63.7 percent. Distressed properties still account for 26.4 percent of total sales, which is historically still very high.
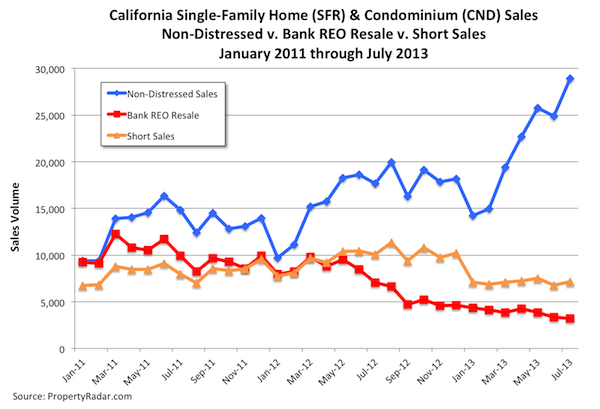
When we divide distressed property sales into short sales and bank REO resales and compare them to non-distressed property sales, we find that since the beginning of the year, short sales have increased only 1.0 percent while bank REO resales have decreased 26.3 percent. Meanwhile, over that same time period, non-distressed property sales have more than doubled, increasing by 103.3 percent.
Homeowner Equity
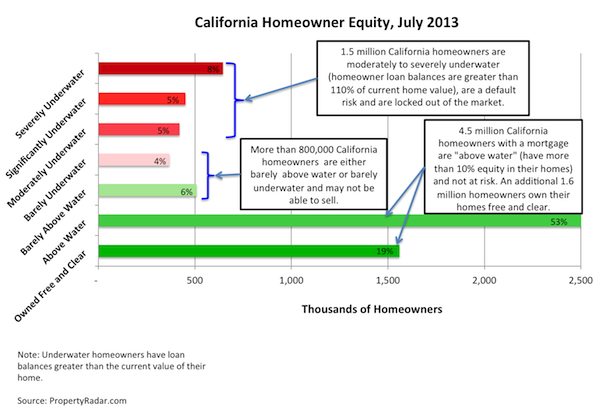
The biggest challenge confronting the California real estate market continues to be the huge numbers of California homeowners owing significantly more than their homes are worth (commonly referred to as underwater homeowners). These homeowners can neither sell their existing home nor buy another and are effectively shut out of the real estate market. In addition, negative equity significantly increases the risk of default.
As of July, 26 percent of 6.8 million California homeowners with a mortgage (1.8 million) were underwater. Furthermore, 500,000 additional homeowners had 10 percent or less equity in their properties and are classified as “barely above water”. In reality, because closing costs associated with the sale of a home typically amount to 6 to 10 percent of the sales price, these homeowners are effectively underwater. When added together, more than one third or 2.3 million underwater and barely above water homeowners are effectively shut out of the California real estate market. Every month, rising real estate prices help thousands of homeowners exit their underwater positions. Despite rising prices, however, nearly 1.5 million homeowners remain moderately to severely underwater and at risk of default.
Median Prices
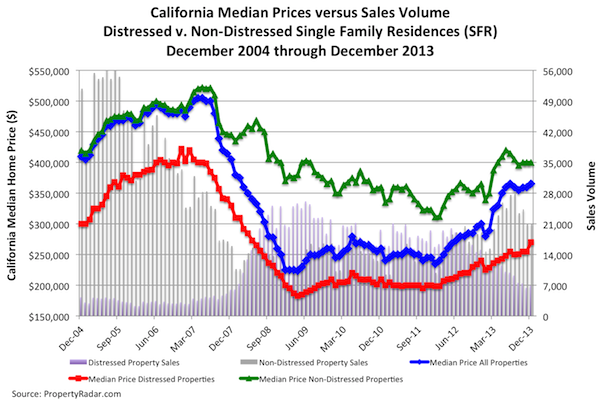
The July median sale price of a California home fell 1.4 percent to $355,000 from $360,000 in June, only the second monthly decline since January 2012. Year-over-year growth in median prices also slowed: the 29.1 percent jump in median sales prices ($355,000 in July 2013 vs. $275,000 in July 2012) was down more than 4 percentage points from the 33.4 percent year-over-year change in June 2013.
The rapid change in the mix of distressed and non-distressed property sales from 2012 to 2013 influenced the year-over-year change in median prices. In July 2012, distressed property sales accounted for 49.3 percent of total sales. By July 2013, distressed property sales had fallen to 26.4 percent of total sales. When we compute year-over-year growth in median prices for the individual components of aggregate sales — distressed and non-distressed properties — we find that on a year-ago basis, the median price of distressed properties jumped 18.6 percent while the median price of non-distressed properties gained 15.4 percent.
In the following graph we highlight median sales price trends from July 2001 to July 2013. Aggregate single-family home median sales prices are shown in blue, and distressed and non-distressed median prices are shown in red and green, respectively.
Cash Sales
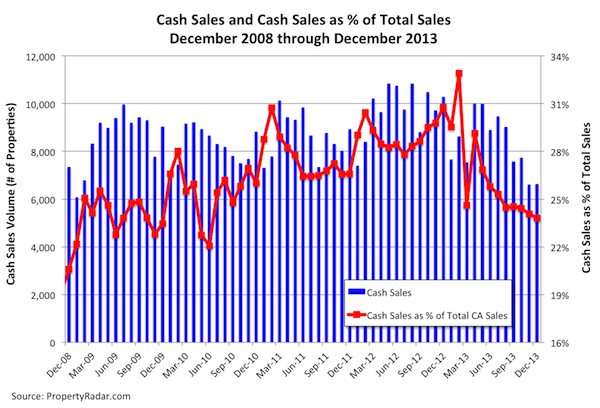
In July 2013, cash sales were 26.1 percent of total sales, up 0.6 percentage points from 25.5 percent in June. Taking a longer-term view, cash sales as a percent of total sales oscillated between 28 percent and 30 percent from January 2012 through January 2013. They peaked at 33.0 percent in February 2013 and have been below 28 percent since May 2013. From a historic perspective, however, cash sales remain high. The following graph punctuates the fact that cash sales remain an important part of the real estate marketplace though now trending lower.
Flipping
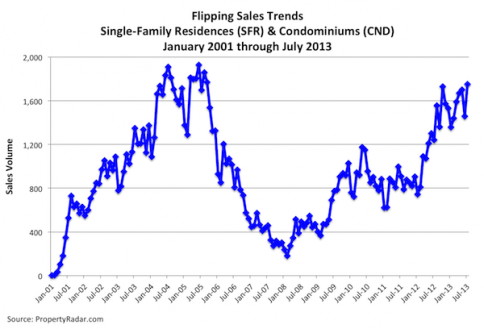
In July 2013, flipping — defined as reselling a property within six months — reached its highest level since September 2005. Flipping has steadily increased since January 2012 due to the increase in profit potential in a market where housing prices are on the rise. In 2011, as housing prices trended sideways, flipping was basically flat, ranging from 2.5 percent of total sales in January, to 2.7 percent of total sales in December 2011. In 2012, flipping began to increase, rising from 2.9 percent of total sales in January 2012 and peaking in October of 2012 at 4.9 percent of sales. From November 2012 to January 2013, flipping sales retreated, reaching an interim bottom at the beginning of the year. Since then, with the exception of a pull-back in June, flipping sales have steadily increased because of attractive housing price gains.
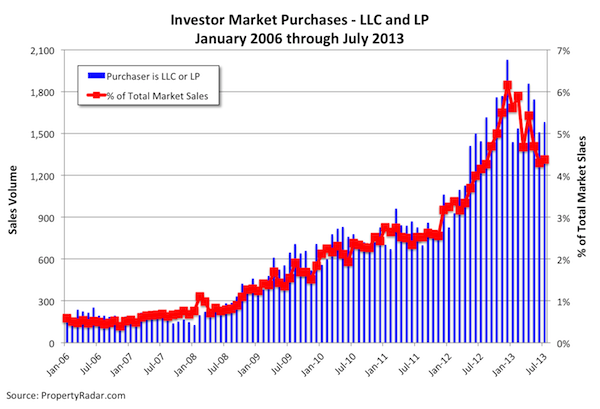
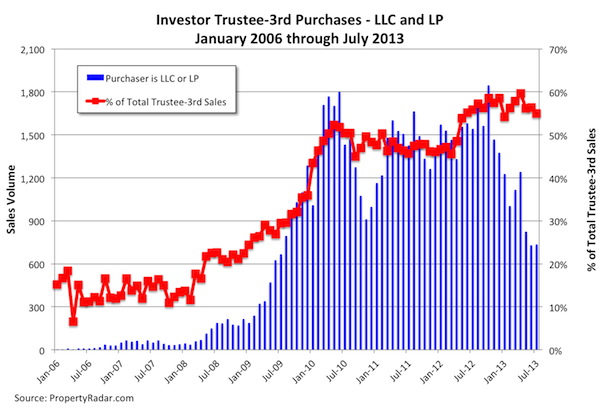
Investor (LLC and LP) Purchase Activity
July 2013 investor purchases, defined as a market or third party purchases at trustee sale by a limited liability corporation (LLC) or a limited partnership (LP), were up slightly from June. Investor market purchases increased 5.0 percent, while investor-third party purchases increased only 0.8 percent. Despite last month’s increase, investor purchases have been trending downward since late last year. Investor market purchases have fallen 22.0 percent since peaking in December 2012, while investor trustee-third party purchases are down 60.1 percent since October 2012.
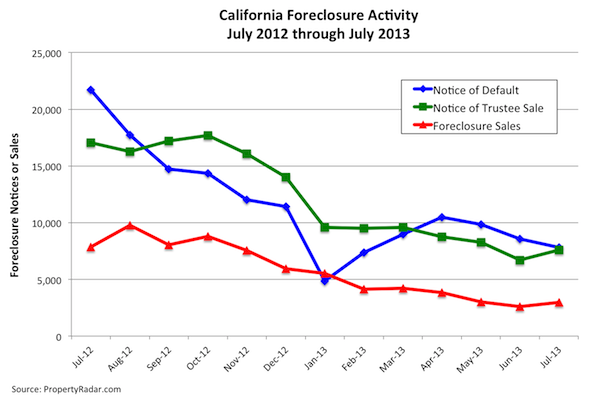
Foreclosures
July 2013 foreclosure sales increased 14 percent from June as several of the largest banks resumed their foreclosure sales following a temporary hiatus caused by a ruling issued by the Office of the Comptroller of the Currency in May. Meanwhile, notices of default fell 8.4 percent in July and were down 63.9 percent for the year. Notices of trustee sale were down 12.9 percent for the month and down 55.6 percent for the year. After posting steady declines since mid-2009, foreclosure notices and sales appear to be leveling off.
Madeline's Take - Director of Economic Research, PropertyRadar
Despite the recent jump in mortgage interest rates, July 2013 sales were at their highest levels since July 2006. Numerous California real estate professionals told me the recent spike in mortgage interest rates encouraged a lot of undecided people to get their properties listed and sold while they still had the chance. Since the end of July, mortgage interest rates have drifted higher in response to the nearly 30-basis-point jump in the 10-year Treasury note. I suspect the recent mortgage interest rate increase will likely push more fence-sitters into the market, driving up August sales as well.
Longer-term, however, rising mortgage interest rates will eventually depress sales and push prices lower in six to eight months hence.
Another trend to watch is median prices. For only the second time since January 2012, California median home prices fell, suggesting that the rapid price increases we have seen over the past 18 months may take a breather as the housing market digests the impact of higher mortgage interest rates.
The decline in investor purchases since late last year also bears notice. While there has been broad-based concern over what would happen when the larger investors begin to exit the market, the jump in July sales suggests that there is enough pent-up demand from non-cash buyers who have been shut out of the marketplace to make up for the drop-off in investor activity.
Sean's Take - Founder/CEO, PropertyRadar
Rising prices and rising interest rates are a one-two combo punch that I’m surprised hasn’t resulted in more damage to the real estate market. Clearly, the rise in interest rates has spooked some buyers into getting off the fence out of concern rates will increase further. It also appears to have spooked some sellers into getting their home listed before the reality of lower affordability due to higher rates sets in. That inventory likely created some opportunities for buyers who have been locked out of the market, increasing sales. That said, I think this combo punch has left the market in a wounded and vulnerable position. The market is clearly at risk, especially if it suffers another direct hit. Bureaucrats take note – now is not the time for further meddling in the real estate markets.