

Home Services | Mortgage | CA Foreclosure Reports
California Sales Slow in September, Down 4.3 Percent from August
Median Price Down 2.4 Percent But Remains Near 8-Year High
Half of Homes Sold in San Francisco and San Mateo Counties Exceed $1 Million[/tweet_dis]
CALIFORNIA, OCTOBER 21, 2015 - Seasonal forces pushed California single-family home and condominium sales down 4.3 percent to 35,629 in September from a revised 37,227 in August but were up 5.8 percent from 33,674 in September 2014. Driving the increase in year-over-year sales was the 9.4 percent increase in non-distressed property sales.
In the first three quarters of 2015, sales were up 7.1 percent compared to the same period in 2014 but remain far below 2002 through 2007 sales volumes.
“Despite the increase over 2014, when you step back and take a look at sales volumes over a longer period of time, they remain weak,” said Madeline Schnapp, Director of Economic Research for PropertyRadar. “Lack of inventory and declining affordability are holding sales back.”
The median price of a California home in September was $405,000, down 2.4 percent from a revised $415,000 in August and down 2.6 percent from the 2015 high of $416,000 in July. On a year-over-year basis, the median price of a California home was up 3.3 percent from $392,000 dollars in September 2014.
“Price appreciation in many parts of the state has slowed or stopped,” said Schnapp. “On a monthly basis, prices were lower in 21 of California’s 26 largest counties.”
The counties with the largest price declines were Contra Costa (-5.0 percent), Kern (-5.2 percent) and San Mateo (-3.3 percent). The San Francisco median price declined 11.8 percent for the month but we believe the decline is an artifact of the mix of homes sold rather than an actual price decline. Median prices in San Francisco are typically volatile due to the low volume of sales. Sales volumes that differ by as little as 20 from one month to the next can easily affect the median price by +/-$200,000.
On an annual basis prices are still appreciating but in general at a much slower pace. Home prices in a few northern California counties continue to appreciate rapidly but they are the exception, not the norm. Counties with the highest annual price appreciation rates were Santa Cruz (+18.1 percent), Merced (+15.0 percent), Santa Clara (+13.8 percent) and San Mateo (+11.3 percent).
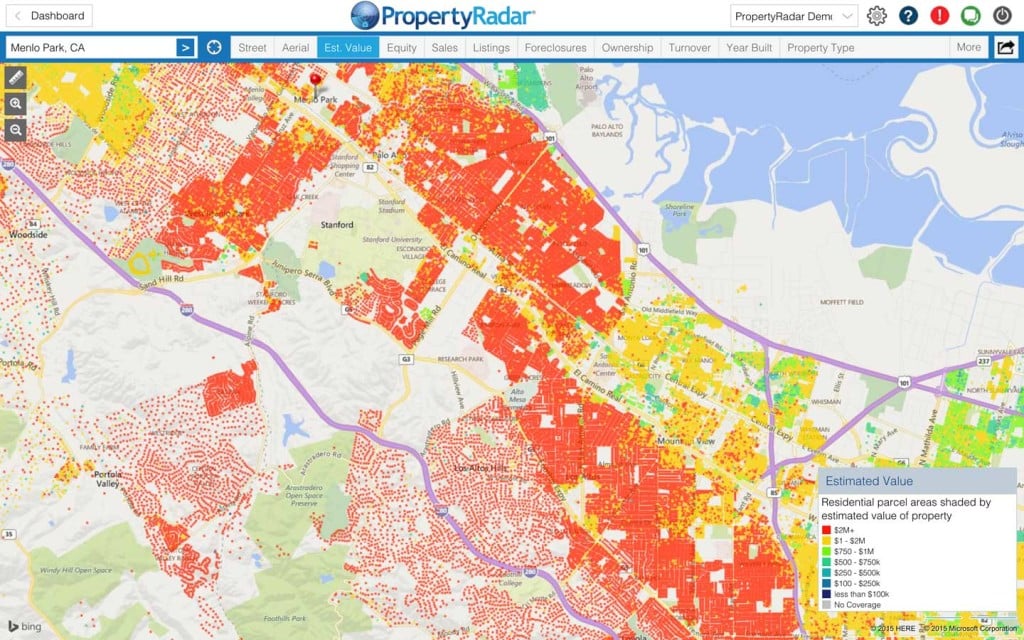
“Home prices in the Silicon Valley corridor, consisting of San Francisco, San Mateo and Santa Clara counties, continue to buck statewide trends and are experiencing double digit price appreciation,” said Schnapp. “The increased demand from plentiful well-paying jobs, exorbitant rents and fear of higher mortgage interest rates has sent home prices into the stratosphere.”
“In September, more than half of all homes sold in San Francisco and San Mateo counties exceeded $1 million,” said Schnapp. “I am frequently asked, ‘how long can this continue’? My answer is, ‘Until you run out of eager buyers and bankers willing to lend,’ and we clearly are not there yet.”
Cash sales fell 7.0 percent in September to 7,243 and represented 20.3 percent of total sales down 0.6 percent from 20.9 percent of total sales in August. Cash sales as a percentage of total sales remain elevated but have been steadily declining since reaching a peak of 45.1 percent of total sales in August 2011.
“Cash does not seem to be in short supply in the Silicon Valley corridor”, said Schnapp. “So far in 2015, 21.5 percent of sales were for cash and 61 percent of buyers put down at least 20 percent of the purchase price. At median price levels bouncing off of a million dollars, that is an impressive statistic.”In other California housing news:
- Flip sales fell 6.4 percent in September but are up 4.0 percent over the past 12 months. Throughout 2015 flip sales steadily increased due to strong price appreciation. Now that price appreciation is slowing, flip sales are likely to retreat.
- The number of homeowners in a negative equity position continued its downward trend in September. Approximately 6.5 percent of homeowners, or nearly 560,000, owed more than their home was worth, down 0.2 percent for the month and 42.5 percent from a year ago. To put the current negative equity level in perspective, in January 2015 nearly one million California homeowners were underwater, or one in nine. Today, one in 15 California homeowners are underwater.[/tweet_dis]
- Institutional Investor (LLC and LP entities) purchases fell 6.7 percent to 1,193 during the month of September but are up 2.0 percent from September 2014. Since reaching a peak in December 2012, institutional investor demand has declined 48.4 percent. Trustee Sale purchases by LLC and LPs were down 82.1 percent from their October 2012 peak but have trended mostly sideways since May 2014. Institutional Investor sales were down 4.1 percent for the month and down 14.1 percent from September 2014. Investor sales have been on a downward trend since March 2015.
- Foreclosure Notices of Default fell 2.0 percent for the month while Notices of Trustee sale retreated 6.0 percent. Foreclosure Sales were nearly unchanged, down 0.2 percent. Foreclosure notices have remained near their lowest levels in our records dating back to 2007 since May 2013. Foreclosure inventories fell 0.6 percent for the month and are down 10.2 percent from September 2014.
Home Sales
Home Sales - Single-family residence and condominium sales by month from 2007 to current divided into distressed and non-distressed sales. Distressed sales are the sum of short sales, where the home is sold for less than the amount owed, and REO sales, where banks resell homes that they took ownership of after foreclosure. All other sales are considered non-distressed.
Year-over-Year Home Sales
Year-over-Year Home Sales Year-over-Year Home Sales - Single-family residences and condominiums sold during the same month for the current year and prior years divided into distressed and non-distressed sales.
Median Sales Prices vs. Sales Volume
Median Sales Price vs. Sales Volume - Median sales price (left axis) of a California single family home versus sales volume (right axis), by month from 2012 to current. Median sales prices are divided into three categories: All single-family homes (black line), distressed properties (red line), and non-distressed properties (blue line). Monthly sales volumes (right axis) are illustrated as gray and lavender bars. The gray bars are distressed sales and the lavender bars are non-distressed sales.
California Homeowner Equity
California Home Owner Equity - A model estimate of California homeowners segregated into various categories of levels of homeowner equity for a given month. Homeowner numbers represent a percentage of total California homeowners.
Cash Sales
Cash Sales - The blue bars (right axis) illustrate cash sales of single-family residences and condominiums by month. The red line (left axis) illustrates cash sales as a percentage of total sales by month.
Flipping
Flipping – The number of single-family residences and condominiums resold within six months.
Market Purchases by LLCs and LPs
Market Purchases by LLCs and LPs - The blue bars (right axis) illustrate market purchases of single-family residences and condominiums by LLCs and LPs from 2007 to current. The red line graph (left axis) illustrates LLC and LP purchases as a percentage of total sales by month.
Market Sales by LLCs and LPs
Market Sales by LLCs and LPs - The blue bars (right axis) illustrate market sales by LLCs and LPs of single-family residences and condominiums by month. The red line graph (left axis) illustrates sales as a percentage of total sales by month.
Trustee Sale Purchases by LLCs and LPs
Trustee Sale Purchases by LLCs and LPs - The blue bars (right axis) illustrate trustee sale purchases (foreclosure sales) of single-family residences and condominiums by LLCs and LPs from 2007 to current. The red line graph (left axis) illustrates purchases as a percentage of total trustee sales by month.
Foreclosure Notices and Sales
Foreclosure Notices and Sales - Properties that have received foreclosure notices — Notice of Default (green) or Notice of Trustee Sale (blue) — or have been sold at a foreclosure auction (red) by month.
Foreclosure Inventories
Foreclosure Inventory - Preforeclosure inventory estimates the number of properties that have had a Notice of Default filed against them but have not been Scheduled for Sale, by month. Scheduled for Sale inventory represents properties that have had a Notice of Trustee Sale filed but have not yet been sold or had the sale cancelled, by month. Bank-Owned (REO) inventory means properties sold Back to the Bank at the trustee sale and the bank has not resold to another party, by month.
Real Property Report Methodology
California real estate data presented by PropertyRadar, including analysis, charts and graphs, is based upon public county records and daily trustee sale (foreclosure auction) results. Items are reported as of the date the event occurred or was recorded with the California County. If a county has not reported complete data by the publication date, we may estimate the missing data, though only if the missing data is believed to be 10 percent or less.