

Home Services | Mortgage | CA Foreclosure Reports
No Bounce yet this Spring, March off to Slow Start
March Sales Down 4.7 Percent Year-over-Year, Second Lowest March Since '08
Median Home Price Up 5.6 Percent Year-over-Year to $415,000
CALIFORNIA, APRIL 20, 2016 – California single-family home and condominium sales were 33,365 in March 2016, an increase of 34.1 percent from a revised 24,886 in February 2016. The large March increase is typical for this time of year and marks the start of the spring selling season. On a year ago basis, sales were down 4.7 percent from 35,023 in March 2015, the second-lowest March since 2008. On a quarterly basis, Q1 2016 sales were down 1.2 percent from Q1 2015, also the second-lowest Q1 sales since Q1 2008.
“March marks the start of the selling season and sales this past month were the second lowest March since 2008,” said Madeline Schnapp, Director of Economic Research for PropertyRadar. “The lack of inventory and terrible affordability are a drag on sales. Without new inventory, sales will likely remain flat for the foreseeable future.
”The March 2016 median price of a California home was $415,000, up 6.4 percent from a revised $390,000 in February 2016. On a year-ago basis, median home prices were up 5.6 percent from $393,000 in March 2015. The median price of a condominium was $400,000, up 3.6 percent from $386,000 in February 2016 but up 3.9 percent from $385,000 from a year ago.“
The increase in the median price from February 2016 to March 2016 is a great example of the influence of the shift in mix of homes sold rather than the price of a house actually increasing,” said Schnapp. “In February, there were more lower-priced homes sold than higher-priced homes. Conversely, the mix shifted in March when more higher-priced homes sold pushing the median price higher.
”Within the 26 largest California counties, the highest year-over-year price appreciation occurred primarily in Northern California counties: Santa Cruz (14.5 percent), Santa Clara (12.6 percent), Marin (11.5 percent), Contra Costa (9.5 percent), and Los Angeles (9.1 percent).“
"Affordability and lack of inventory is a challenge in every part of the state with a decent job market. The closer you are to the coast, the worse it gets,” said Schnapp. “As prices march steadily higher, they eventually hit a level where you run out of buyers willing to pay those prices. Are we there, yet? Probably not, but we are certainly getting closer!”
The number of homeowners in a negative equity position fell this past month as prices rose and the pace of sales activity increased. Currently, the number of negative equity households is slightly less than 550,000.
“In the past 13 months, more than half a million California homeowners have exited their negative equity position making them eligible to sell their existing home and perhaps buy another,” said Schnapp. “That means that while in March 2015 one in nine California homeowners were underwater, today that number is one in sixteen.”
“In the past week, the Federal Housing Finance Agency (FHFA) announced a new principal reduction program,” said Schnapp. “While it appears to offer hope for those in California still underwater, the program is so limited as to likely have little, if any, impact here. FHFA estimates that nationwide only 33,000 homeowners will benefit. This is likely the last homeowner bailout, so underwater homeowners in California still hoping for relief appear to be out of luck.”
Foreclosure Notices of Default (NODs) in March 2016 were up 7.8 percent from February 2016 but were down 1.8 percent from March 2015. NODs have increased 32.3 percent since reaching an interim low in November 2015. Notices of Trustee Sale (NTS) increased 2.9 percent for the month but were down 23.6 percent over the past 12 months. Notices of Trustee Sale were near their lowest levels in our records dating back to January 2007. Foreclosure Sales were nearly unchanged for the month but were down 16.6 percent over the past 12 months.
“The 32 percent increase in Notices of Default over the past five months caught our attention,” said Schnapp. “While the increase may be seasonal, it may also be due to loan modification resets as loans from 2005 through 2007 default for the second time.”
“For the past year, the uncertainty of the impact of rising interest rates has been a worry for would-be buyers,” said Schnapp. “Back in January, the 25-basis point interest rate increase by the FED roiled the stock markets big-time. Stung by that reaction, we believe the FED will probably postpone further interest rate hikes until next year, particularly since this is an election year. The last thing the FED wants is a FED induced market disruption that impacts voter sentiment one way or the other.”
In other California housing news:
- Cash Sales - Cash sales of single-family homes and condominiums in March 2016 were up 18.9 percent from February 2016 but down 10.6 percent from March 2015. March cash sales were 22.1 percent of total sales, in line with the average percentage of cash sales over the past 12 months. Within the 26 largest counties in California, the counties with the highest percentage of cash sales were Marin (35.9 percent), San Luis Obispo (27.0 percent), Santa Cruz (26.4 percent), Monterey (26.0 percent), and Placer (24.9 percent).
- Flip Sales - Flip sales in March 2016 gained 26.1 percent for the month and were up 12.5 percent over the past 12 months. Flip sales accounted for 3.7% of total sales, the lowest since October 2015. With the onset of the spring selling season, flip sales increased in response to pent-up demand and higher prices. Flip activity will likely remain elevated through June 2016.
- Institutional Investor (LLC and LP entities) Purchases increased 17.2 percent in March 2016, in line with the average purchase level over the past 12 months. On a year-ago basis, purchases were down 1.0 percent from March 2015. Seasonal variations notwithstanding, purchases have been oscillating around the 1,200 to 1,400 per month level since October 2013.
- Trustee Sale purchases by LLC and LPs were up 1.9 percent for the month and gained 3.5 percent from March 2015. Over a longer period of time, Trustee sale purchases have been trending mostly sideways since November 2013.
- Institutional Investor sales by LLC and LPs were up 23.8 percent for the month but were down 14.6 percent from March 2015. Despite the increase this past month, investor sales have been on a steady downward trend since reaching a peak in December 2012.
Home Sales
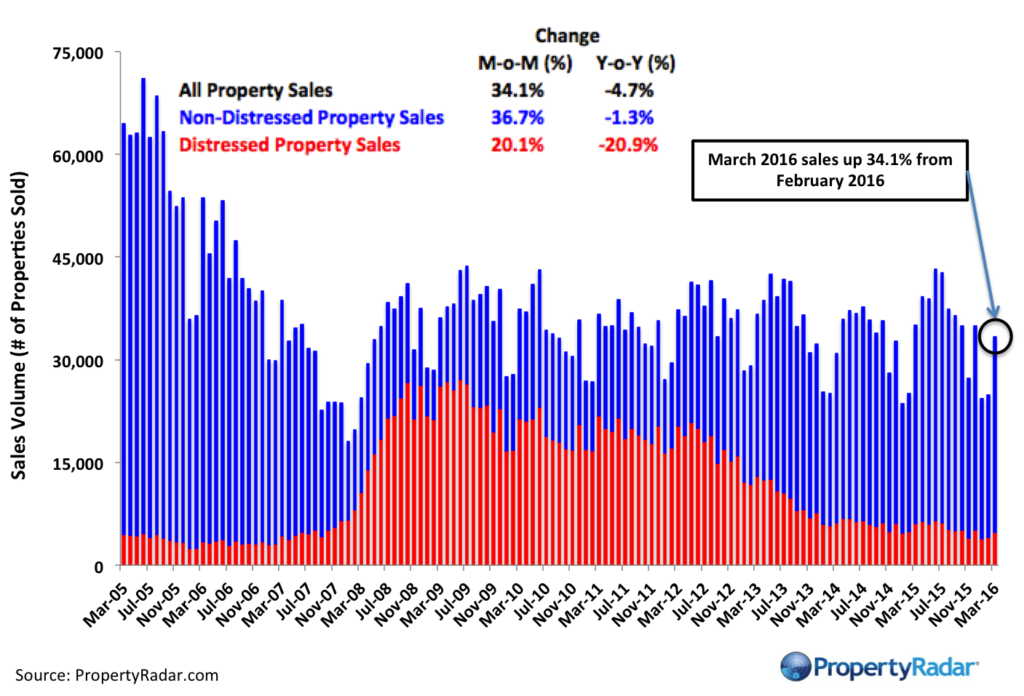
Home Sales - Single-family residence and condominium sales by month from 2007 to current divided into distressed and non-distressed sales. Distressed sales are the sum of short sales, where the home is sold for less than the amount owed, and REO sales, where banks resell homes that they took ownership of after foreclosure. All other sales are considered non-distressed.
Year-over-Year Home Sales
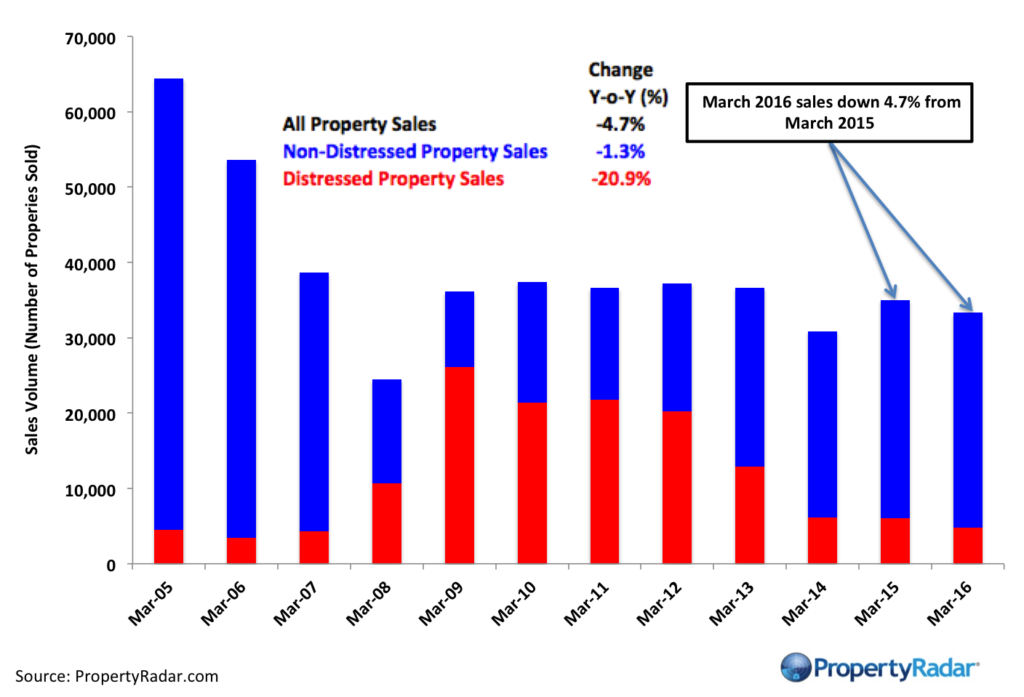
Year-over-Year Home Sales Year-over-Year Home Sales - Single-family residences and condominiums sold during the same month for the current year and prior years divided into distressed and non-distressed sales.
Median Sales Prices vs. Sales Volume
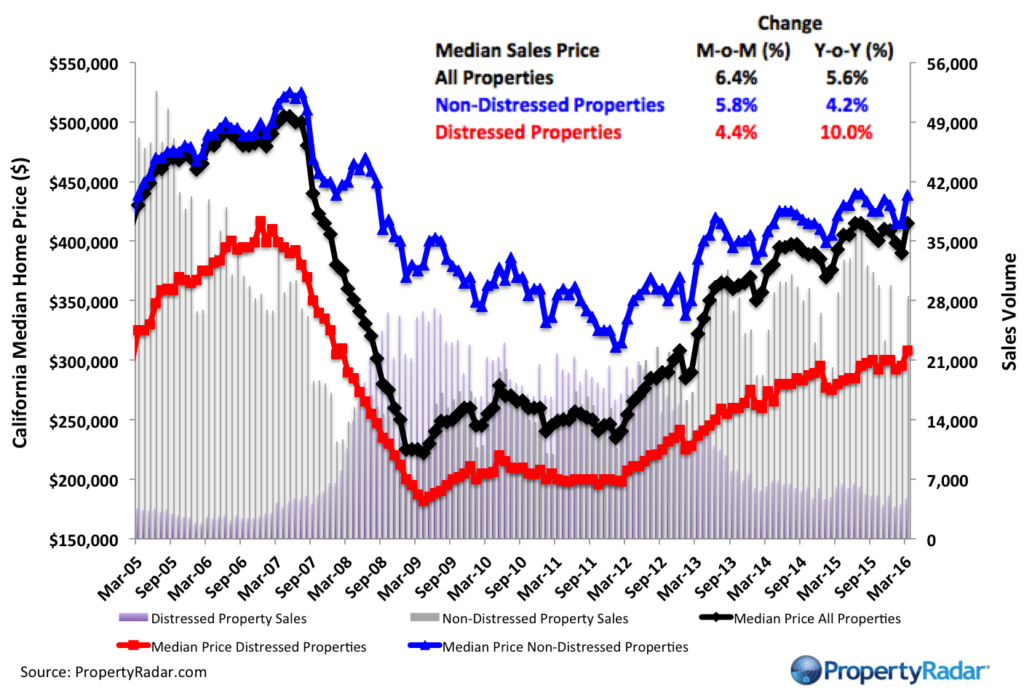
Median Sales Price vs. Sales Volume - Median sales price (left axis) of a California single family home versus sales volume (right axis), by month from 2012 to current. Median sales prices are divided into three categories: All single-family homes (black line), distressed properties (red line), and non-distressed properties (blue line). Monthly sales volumes (right axis) are illustrated as gray and lavender bars. The gray bars are distressed sales and the lavender bars are non-distressed sales.
California Homeowner Equity
California Home Owner Equity - A model estimate of California homeowners segregated into various categories of levels of homeowner equity for a given month. Homeowner numbers represent a percentage of total California homeowners.
Cash Sales
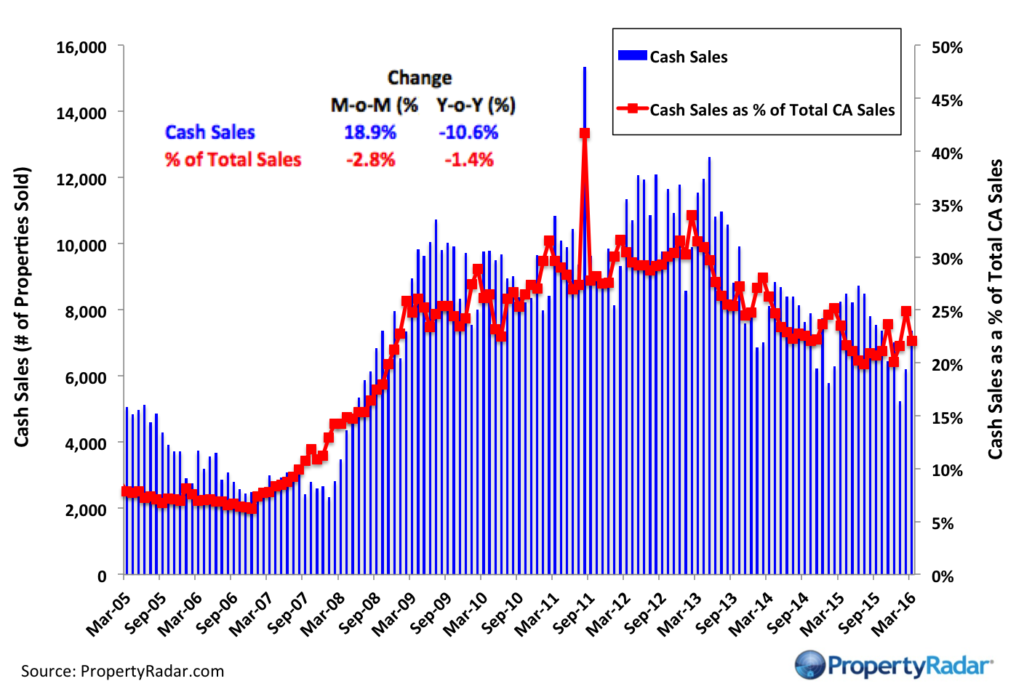
Cash Sales - The blue bars (right axis) illustrate cash sales of single-family residences and condominiums by month. The red line (left axis) illustrates cash sales as a percentage of total sales by month.
Flipping
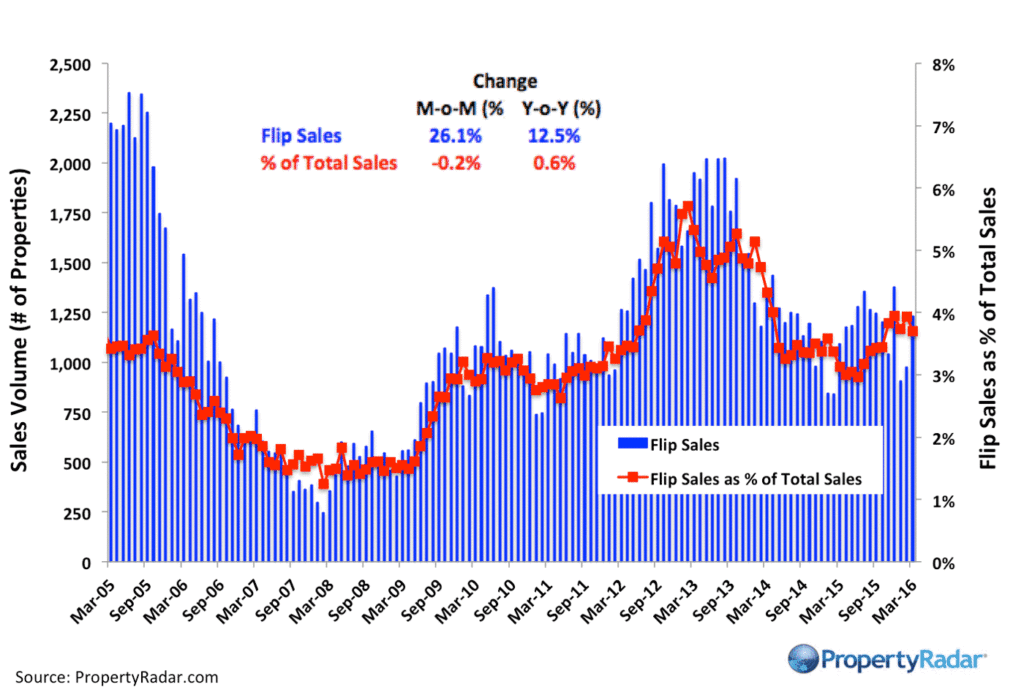
Flipping – The number of single-family residences and condominiums resold within six months.
Market Purchases by LLCs and LPs
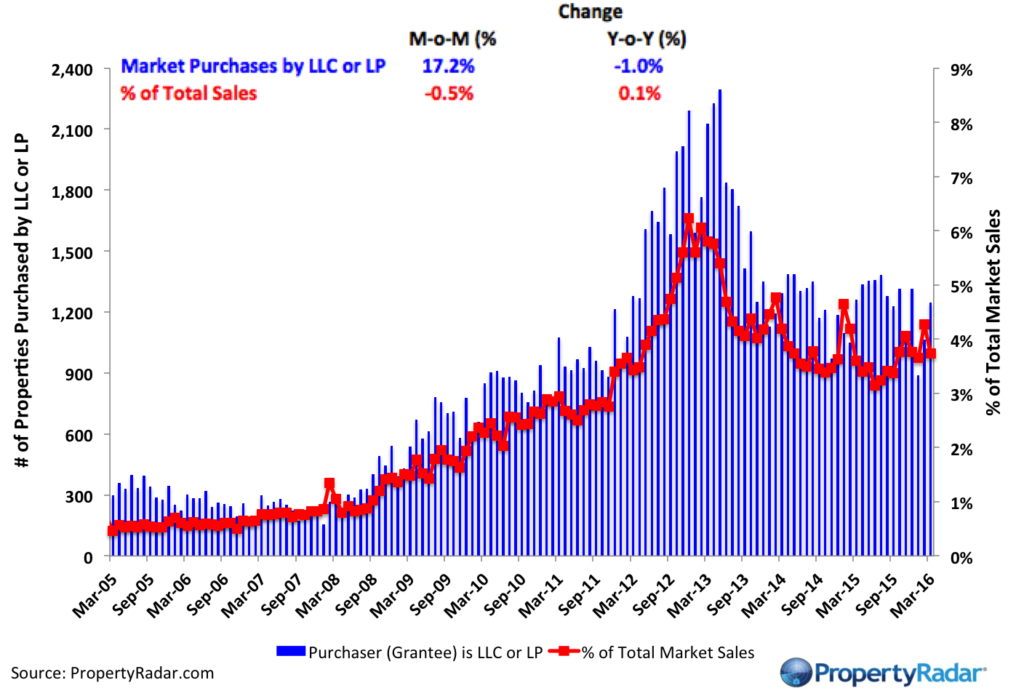
Market Purchases by LLCs and LPs - The blue bars (right axis) illustrate market purchases of single-family residences and condominiums by LLCs and LPs from 2007 to current. The red line graph (left axis) illustrates LLC and LP purchases as a percentage of total sales by month.
Market Sales by LLCs and LPs
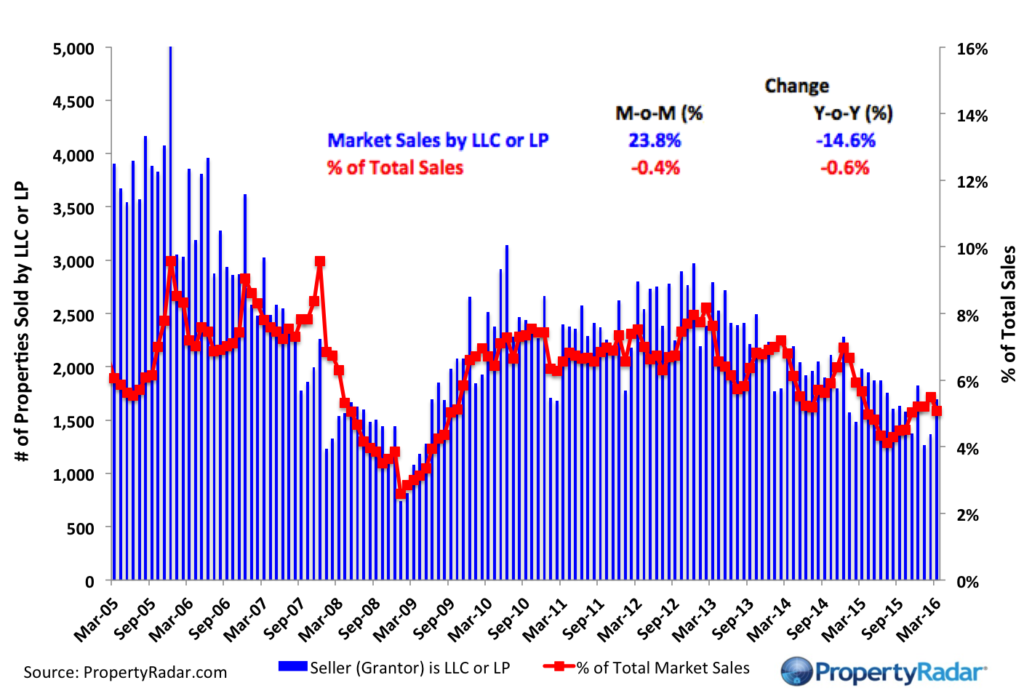
Market Sales by LLCs and LPs - The blue bars (right axis) illustrate market sales by LLCs and LPs of single-family residences and condominiums by month. The red line graph (left axis) illustrates sales as a percentage of total sales by month.
Trustee Sale Purchases by LLCs and LPs
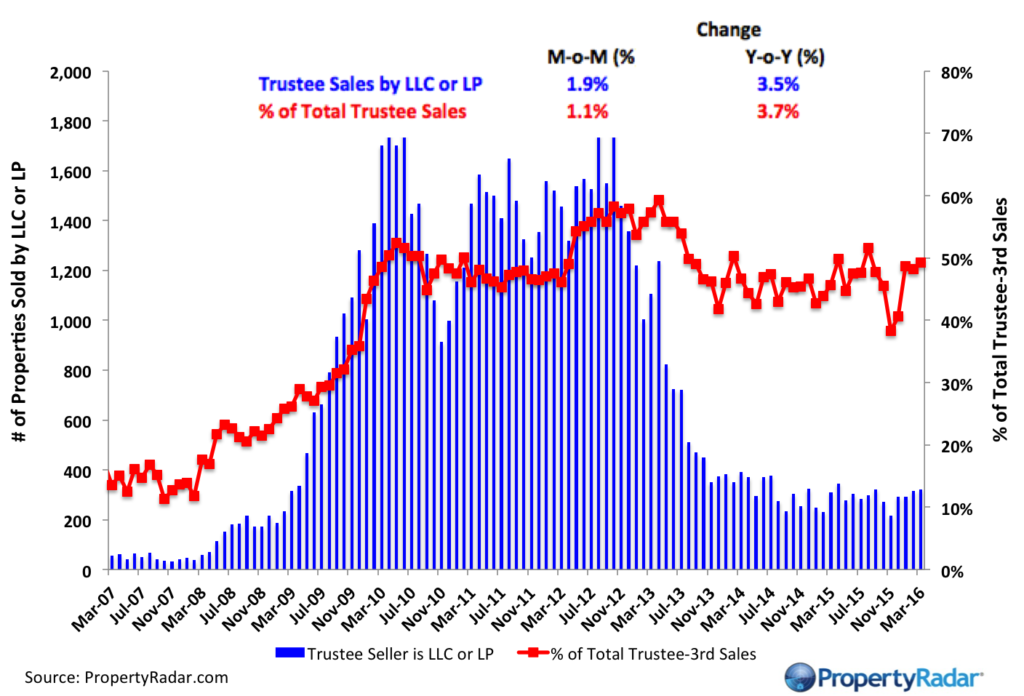
Trustee Sale Purchases by LLCs and LPs - The blue bars (right axis) illustrate trustee sale purchases (foreclosure sales) of single-family residences and condominiums by LLCs and LPs from 2007 to current. The red line graph (left axis) illustrates purchases as a percentage of total trustee sales by month.
Foreclosure Notices and Sales
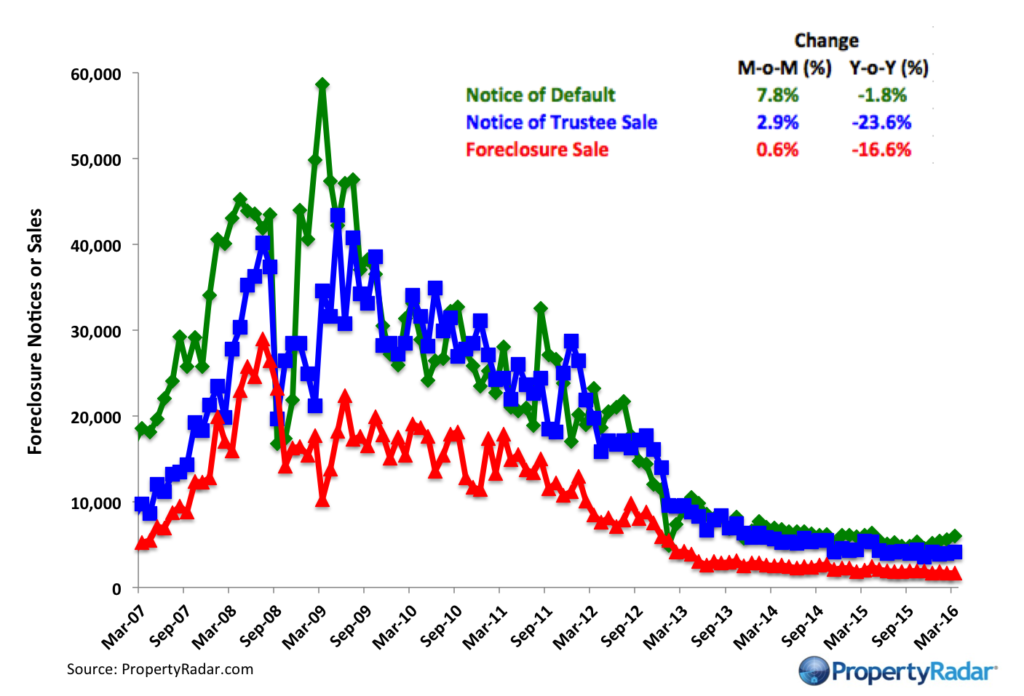
Foreclosure Notices and Sales - Properties that have received foreclosure notices — Notice of Default (green) or Notice of Trustee Sale (blue) — or have been sold at a foreclosure auction (red) by month.
Foreclosure Inventories
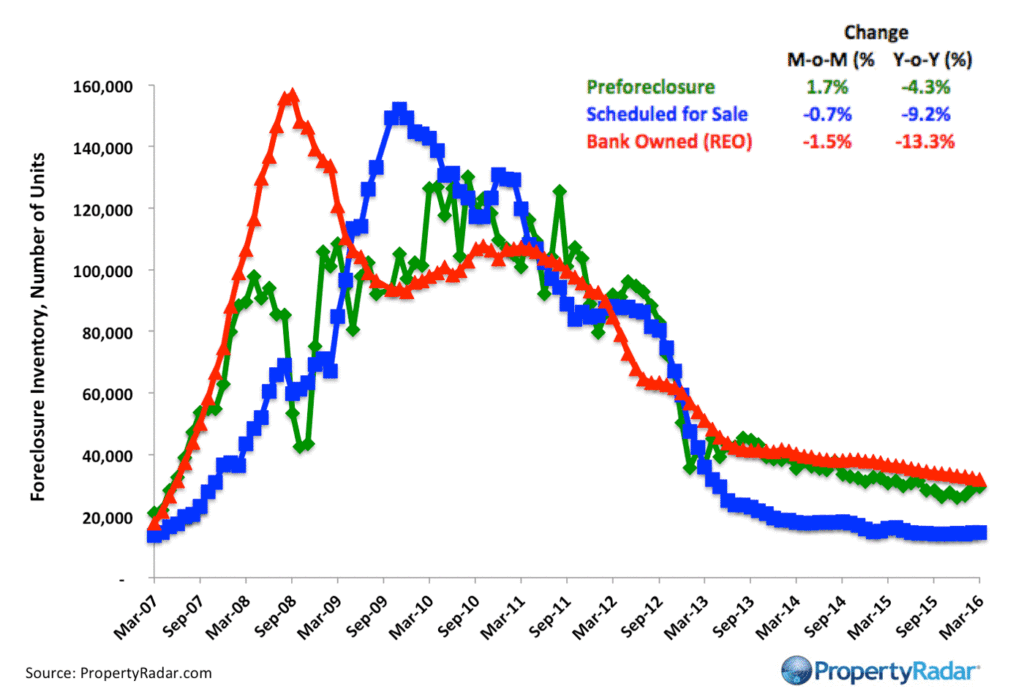
Foreclosure Inventory - Preforeclosure inventory estimates the number of properties that have had a Notice of Default filed against them but have not been Scheduled for Sale, by month. Scheduled for Sale inventory represents properties that have had a Notice of Trustee Sale filed but have not yet been sold or had the sale cancelled, by month. Bank-Owned (REO) inventory means properties sold Back to the Bank at the trustee sale and the bank has not resold to another party, by month.
Real Property Report Methodology
California real estate data presented by PropertyRadar, including analysis, charts and graphs, is based upon public county records and daily trustee sale (foreclosure auction) results. Items are reported as of the date the event occurred or was recorded with the California County. If a county has not reported complete data by the publication date, we may estimate the missing data, though only if the missing data is believed to be 10 percent or less.