

Home Services | Mortgage | CA Foreclosure Reports
2016 California Home Sales Down 2.9 Percent from 2015, Remain Essentially Flat Since 2009
2016 California Median Home Price Up 4.1 Percent Year-over-Year
150,000 California Homeowners Escape Negative Equity Prison in 2016
Real Property Report — California, December 2016
CALIFORNIA, JANUARY 26, 2017 – 2016 California home sales (single-family home and condominium) were up 0.6 percent in December 2016 to 33,678 from 33,479 in November 2016. For the year, sales were down 10.3 percent from 37,547 in December 2015.
“The TILA-RESPA Integrated Disclosure (TRID) rule that went into effect in November 2015 depressed year-over-year sales comparisons,” said Madeline Schnapp, Director of Economic Research for PropertyRadar. “Accounting for the TRID impact, we estimate California home sales were unchanged compared to a year ago.”
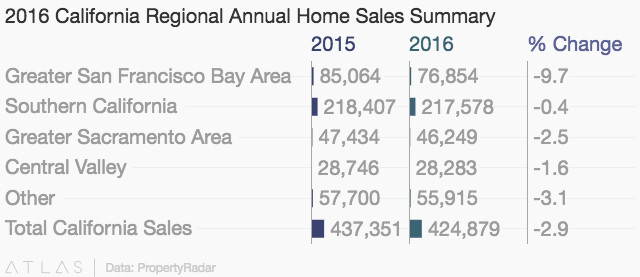
Annual sales totals (January through December) smooth out year-end volatility and provide a longer-term view of California real estate trends. Sales in 2016 were down 2.9 percent from 2015. At the regional level, in the Greater San Francisco Bay Area 2016 sales fell 9.7 percent from 2015, were nearly unchanged in Southern California, down 2.5 percent in the Greater Sacramento region and lower by 1.6 percent in the Central Valley.
“In general, affordability and sales results go hand in hand,” said Schnapp. “The Greater San Francisco Bay Area is the least affordable housing market in the state. It should come as no surprise that this area saw much lower sales volumes this year relative to last. At some point, you reach the limit of what people can pay which in turn limits sales.”
The median price of a California home was $430,000 in December 2016, down 1.1 percent from $435,000 in November but up 4.1 percent from $413,000 a year ago. In the Greater San Francisco Bay Area, median home prices in three counties exceeded one million dollars, Marin ($1.05 million), San Francisco ($1.35 million) and San Mateo County ($1.23 million).
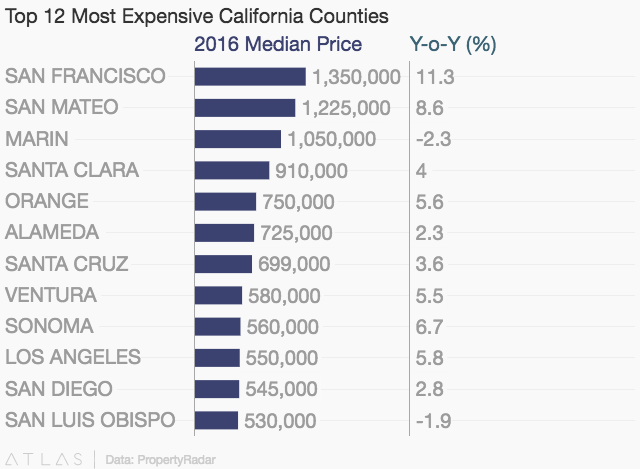
Within the 26 largest counties in California, on a year-ago basis, prices were higher in all but three counties. The counties with the largest annual price gains were San Francisco (+11.3 percent), San Mateo (+8.6 percent), Sonoma (+6.7 percent), Los Angeles (+5.8 percent) and Orange (+5.6 percent).
“Price gains, particularly in the more desirable coastal regions of the state, continue to outstrip both economic and income growth,” said Schnapp. “Lack of supply amidst rising demand has been the dominant theme for several years keeping a lid on sales. New building projects in many counties are coming online and beginning to add inventory. More inventory in 2017 should help alleviate some of the supply problem.”
In 2016, 150,000 homeowners exited their negative equity positions and can now participate in the housing market. In December, the percentage of homeowners in a negative equity position was 4.8 percent down from 6.5 percent a year ago.
“The fact that 150,000 homeowners exited their negative equity prisons last year is big news,” said Schnapp. “These homeowners are now free to refinance their mortgages or actively participate in the housing market. These newly minted positive equity homeowners are a welcome addition to an inventory constrained market.”
Cash sales during the month of December fell 1.2 percent from November and were down 12.1 percent from December 2015. Cash sales in 2016 were down 7.6 percent compared to 2015 and represented 20.2 percent of total sales.
In December 2016, the counties with the highest percentage of cash sales were San Luis Obispo (+25.9 percent), Tulare (+23.1 percent), Fresno (+21.9 percent), Riverside (+21.6 percent) and Orange (+21.5 percent).
“In December, Bay Area counties were notably absent from the top five list of counties with the highest percentage of cash sales,” said Schnapp. “Instead, several lower priced counties made the list suggesting that cash buyers were finding attractive purchase opportunities where buyers get more bang for their housing buck.”
“While the lack of inventory has been a challenge for the housing market for several years now, in 2017 the dominant concern is the unknown trajectory of mortgage interest rates,” said Schnapp. “With a new president at the helm, the tax and spending proposals and their impact on economic growth going forward is uncertain. If mortgage interest rates remain in the 3.8 to 4.3 percent range, we will consider that a tailwind for the market. Mortgage interest rates in the 4.5 to 5.0 percent range a definite headwind.”
In other California housing news:
- Flip Sales in December 2016 were up 11.0 percent for the month but down 10.5 percent over the past 12 months. For all of 2016, flip sales were 4.2 percent lower than in 2015. Lack of inventory, slower appreciation and lower return on investment are a constraint on flip sales.
- Foreclosure Notices. Notices of Default (NODs) were up 10.4 percent in December from November but down 21.0 percent in the past 12 months.
- Notices of Trustee Sale (NTS) were up 10.1 percent for the month but down 22.2 from December 2015. Despite the December increases, NODs have been on a gradual downward trend since January 2013 while NTS’ have been on a similar downward trajectory since January 2014. Both NODs and NTS’ are near their lowest levels in our records dating back to January 2007.
- Foreclosure Sales were down 18.9 percent for the month and fell 27.2 percent from December 2015. Foreclosure sales have followed the gradual downward trend in NODs and NTSs and have been on a similar slow descent since May 2013.
Home Sales
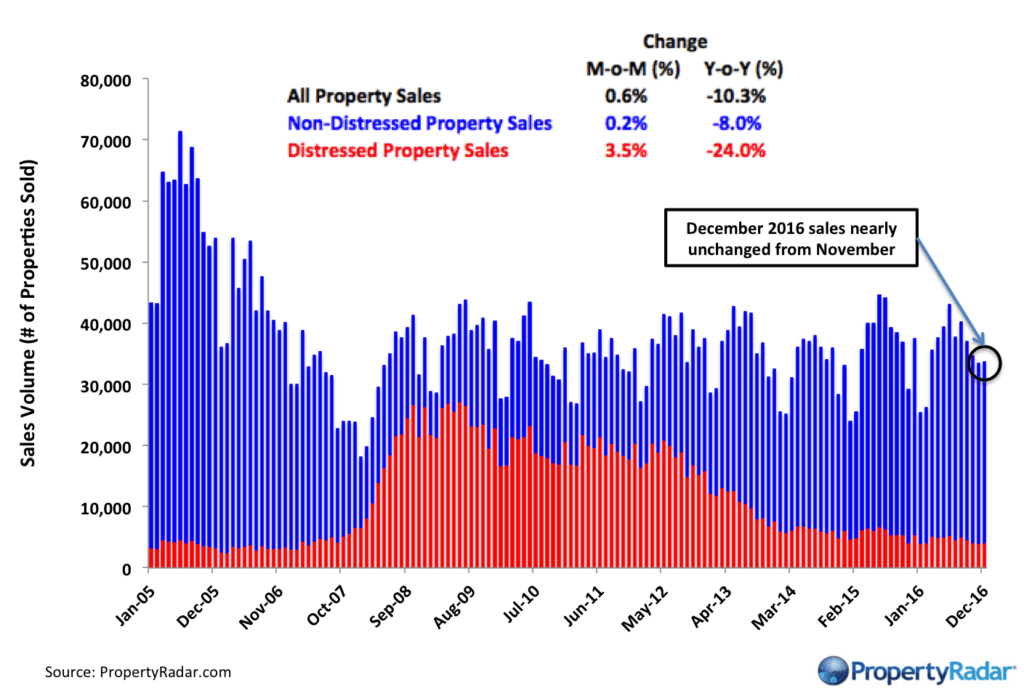
Home Sales - Single-family residence and condominium sales by month from 2005 to current divided into distressed and non-distressed sales. Distressed sales are the sum of short sales, where the home is sold for less than the amount owed, and REO sales, where banks resell homes that they took ownership of after foreclosure. All other sales are considered non-distressed.
Year-over-Year Home Sales
Year-over-Year Home Sales - Single-family residences and condominiums sold during the same month for the current year and prior years divided into distressed and non-distressed sales.
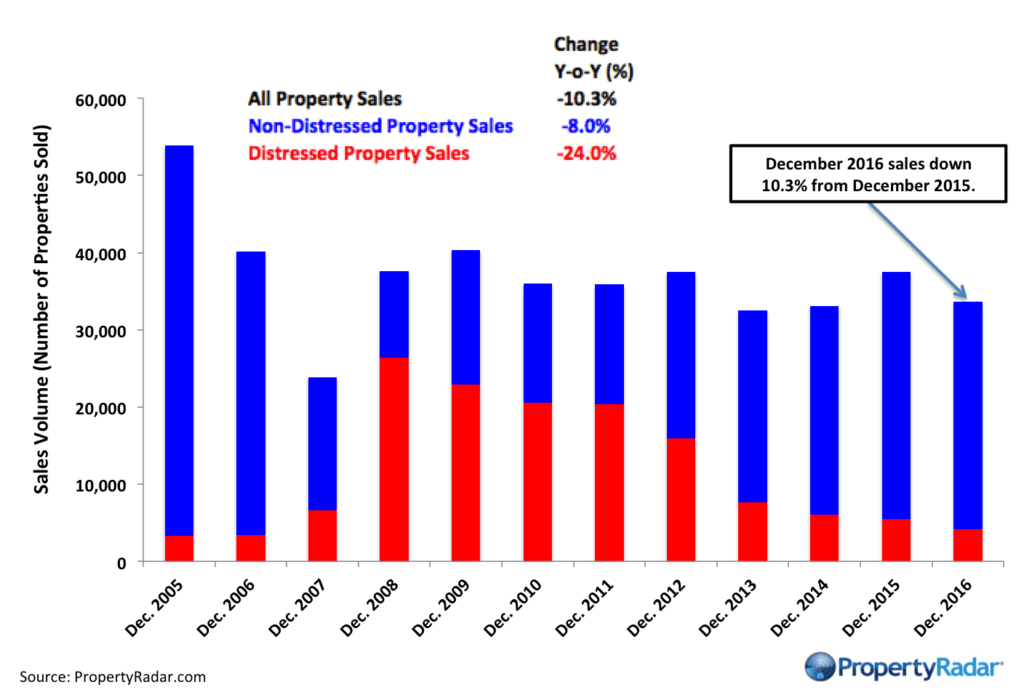
Annual Home Sales
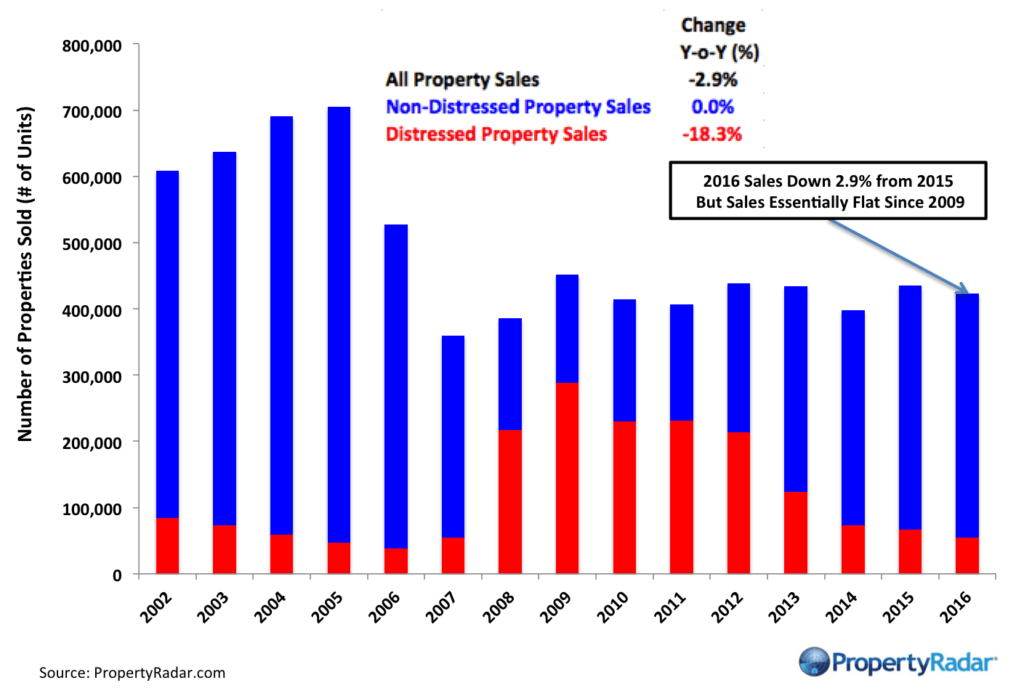
Annual Home Sales – The sum of sales of single-family residences and condominiums for the current year and prior years divided into distressed and non-distressed sales.
Median Sales Prices vs. Sales Volume
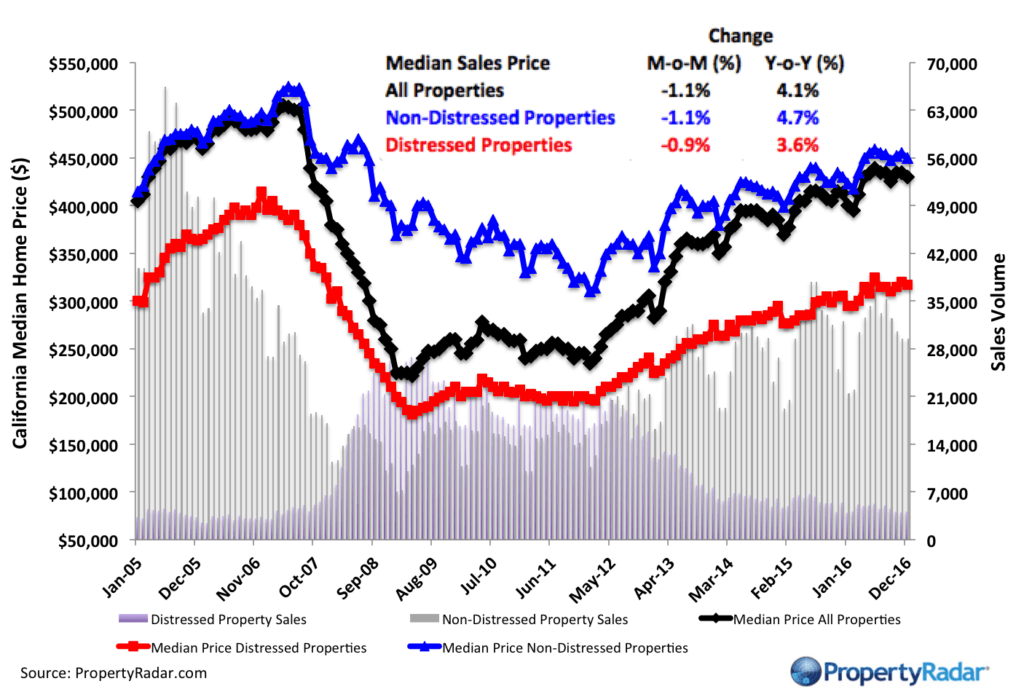
Median Sales Price vs. Sales Volume - Median sales price (left axis) of a California single family home versus sales volume (right axis), by month from 2012 to current. Median sales prices are divided into three categories: All single-family homes (black line), distressed properties (red line), and non-distressed properties (blue line). Monthly sales volumes (right axis) are illustrated as gray and lavender bars. The gray bars are non-distressed sales, and the lavender bars are distressed sales.
California Homeowner Equity
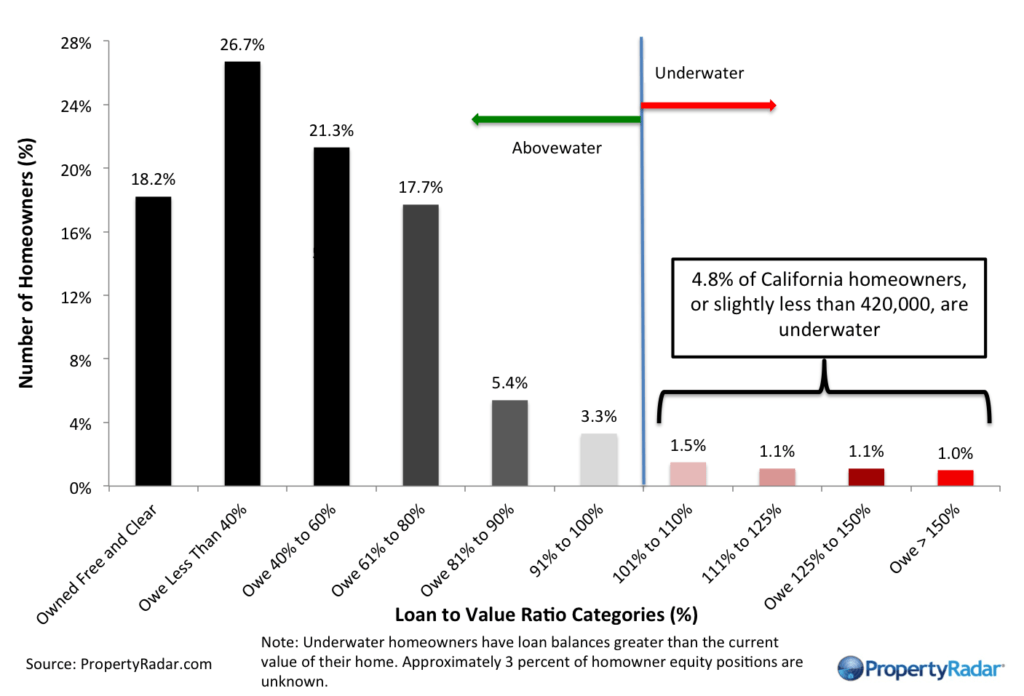
California Home Owner Equity - A model estimate of California homeowners segregated into various categories of levels of homeowner equity for a given month. Homeowner numbers represent a percentage of total California homeowners.
Cash Sales
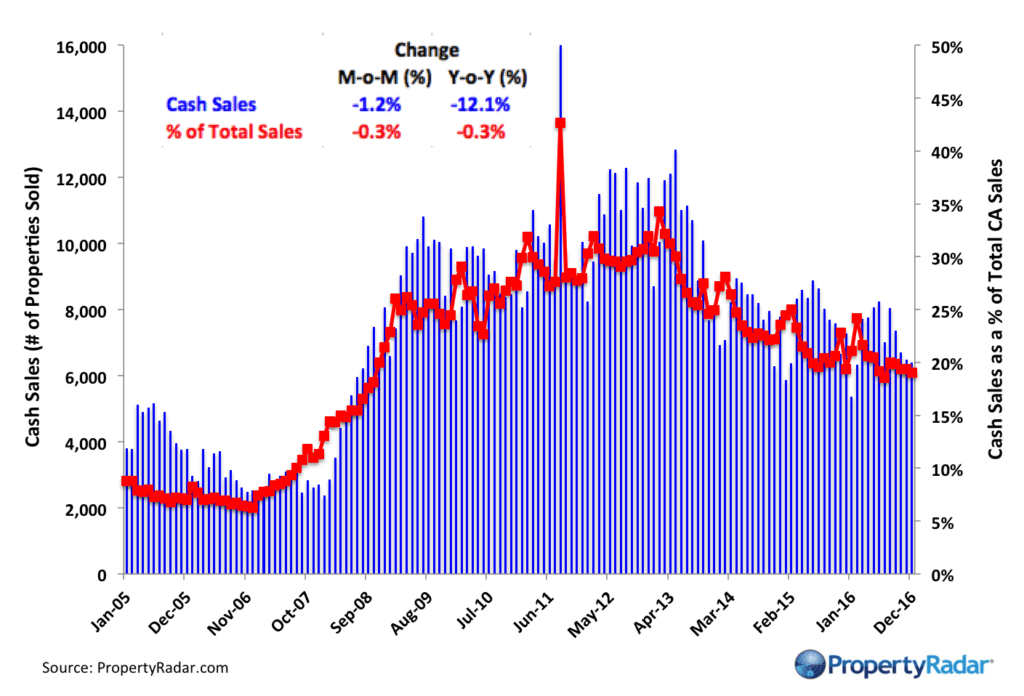
Cash Sales - The blue bars (right axis) illustrate cash sales of single-family residences and condominiums by month. The red line (left axis) illustrates cash sales as a percentage of total sales by month.
Annual Cash Sales
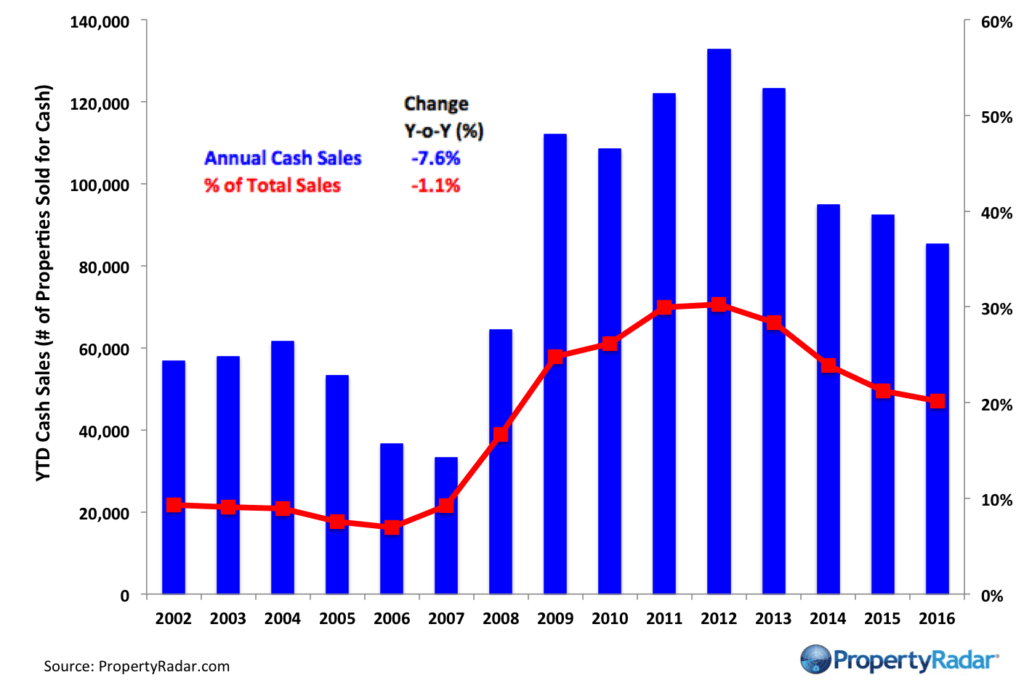
Annual Cash Sales - The blue bars (right axis) illustrate cash sales of single-family residences and condominiums by year. The red line (left axis) illustrates cash sales as a percentage of total sales by year.
Flipping
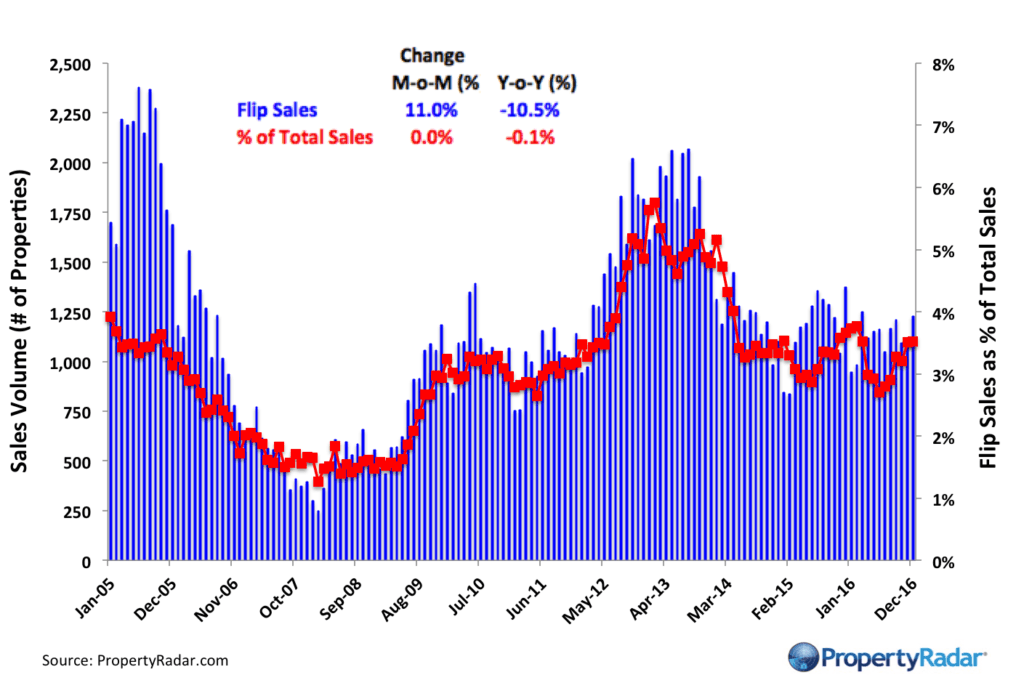
Flipping – The number of single-family residences and condominiums resold within six months.
Annual Flip Sales
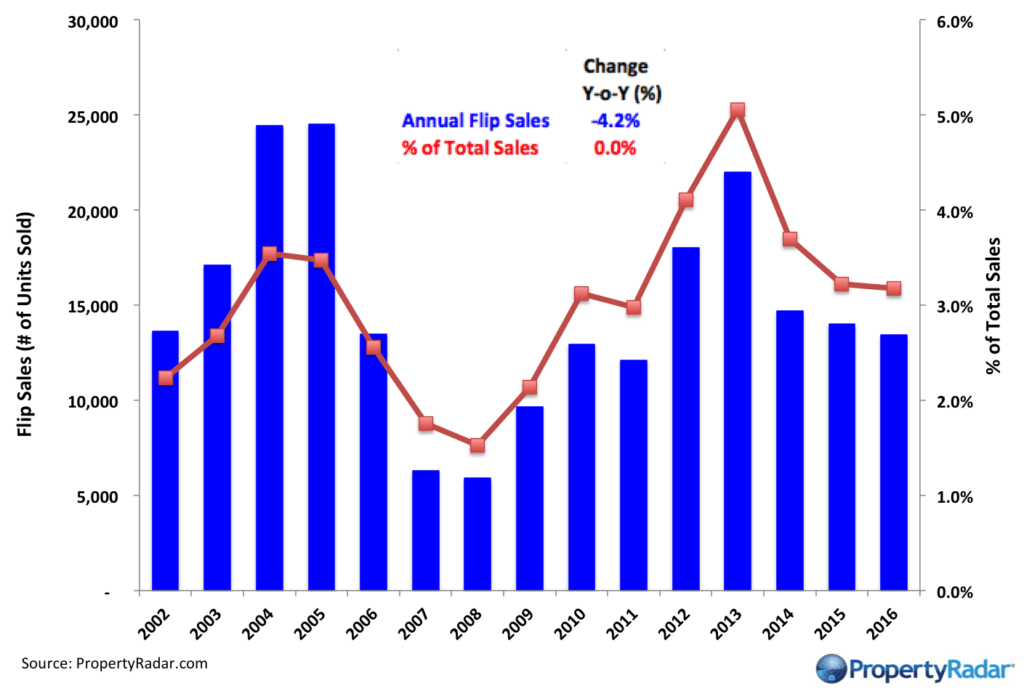
Annual Flip Sales – The annual number of single-family residences and condominiums resold within six months.
Foreclosure Notices and Sales
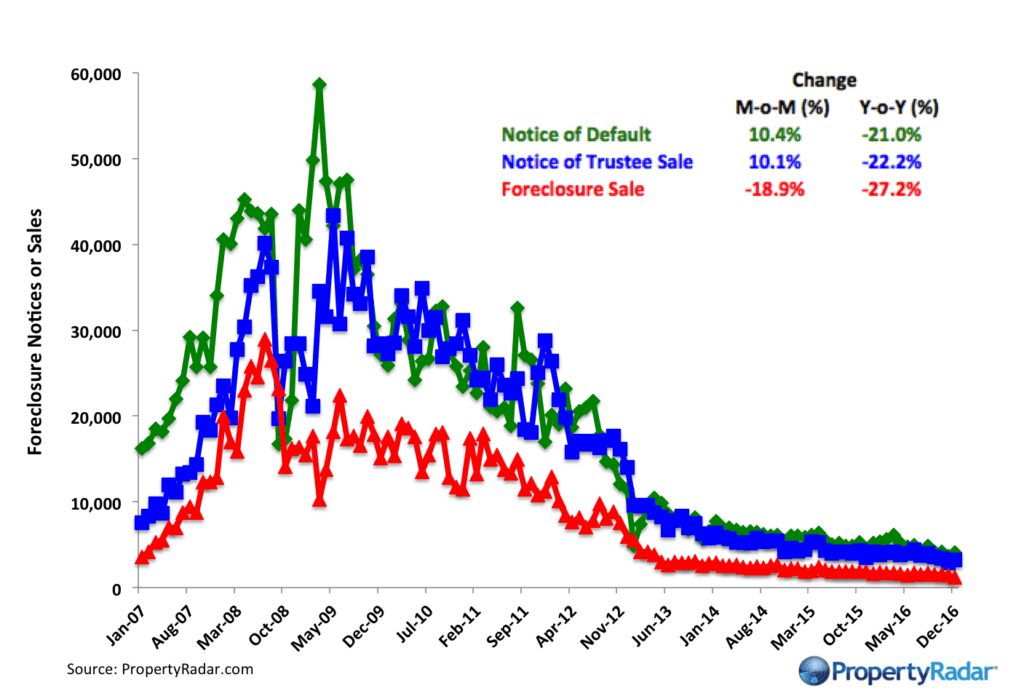
Foreclosure Notices and Sales - Properties that have received foreclosure notices — Notice of Default (green) or Notice of Trustee Sale (blue) — or have been sold at a foreclosure auction (red) by month.
Foreclosure Notices and Sales - 3-Year Trend
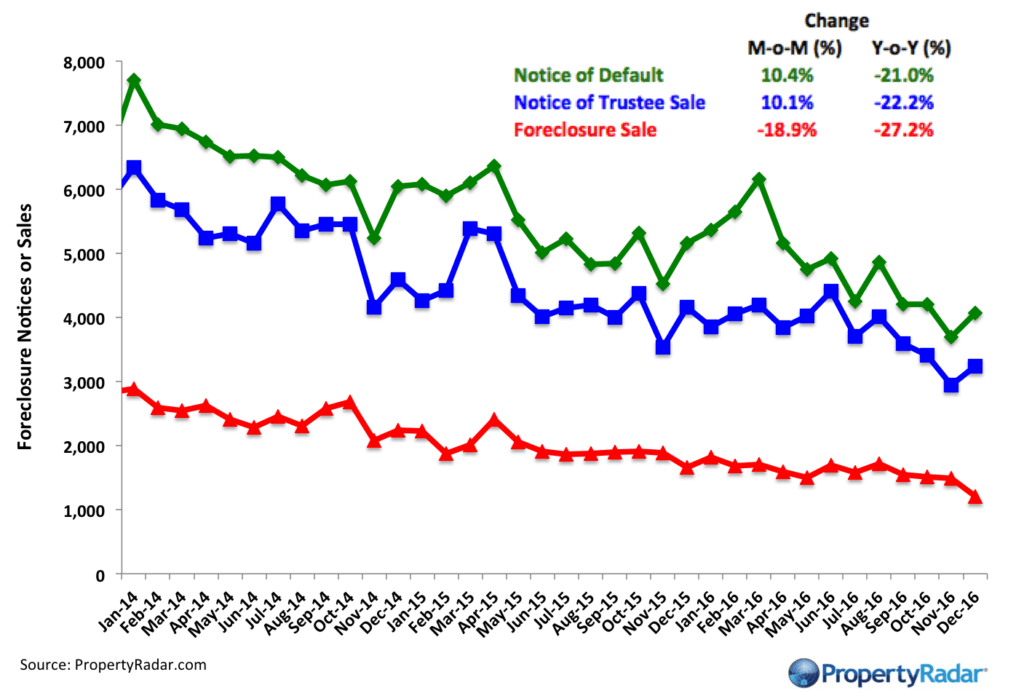
3-Year Foreclosure Notices and Sales - Properties that have received foreclosure notices — Notice of Default (green) or Notice of Trustee Sale (blue) — or have been sold at a foreclosure auction (red) by month.
Annual Foreclosure Notices and Sales
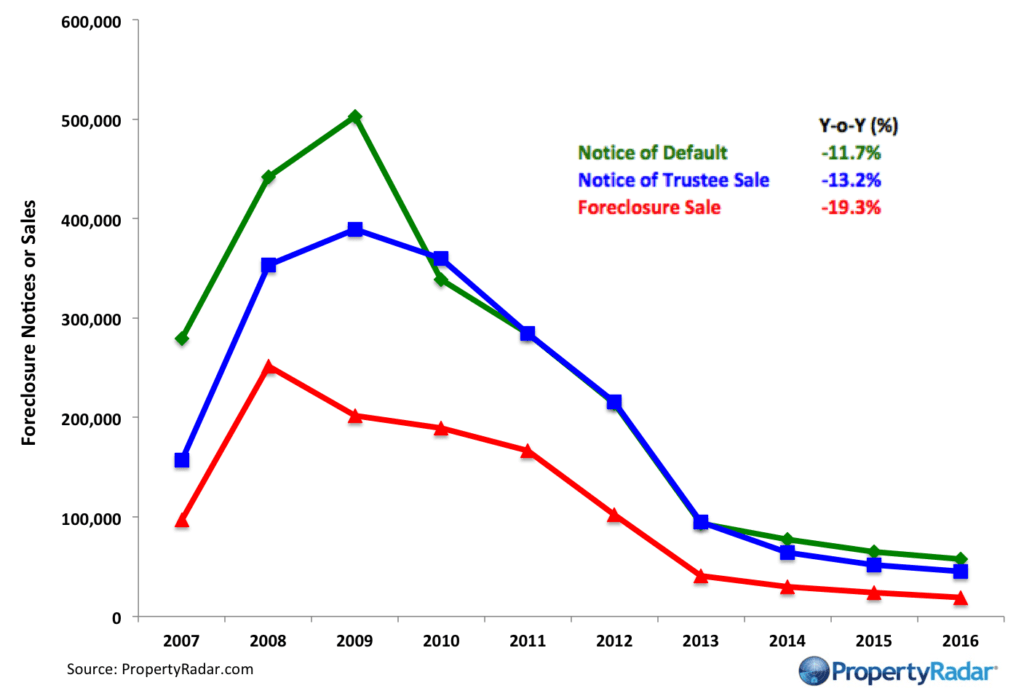
Annual Foreclosure Notices and Sales - Properties that have received foreclosure notices — Notice of Default (green) or Notice of Trustee Sale (blue) — or have been sold at a foreclosure auction (red) by year.
Foreclosure Inventories
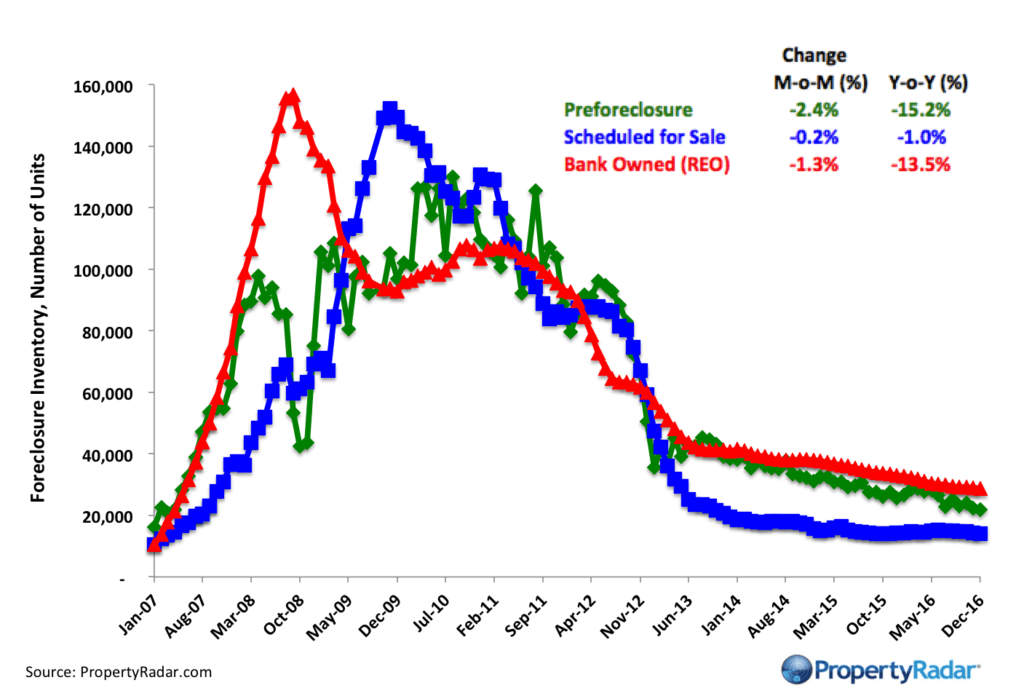
Foreclosure Inventory - Preforeclosure inventory estimates the number of properties that have had a Notice of Default filed against them but have not been Scheduled for Sale, by month. Scheduled for Sale inventory represents properties that have had a Notice of Trustee Sale filed but have not yet been sold or had the sale canceled, by month. Bank-Owned (REO) inventory means properties sold Back to the Bank at the trustee sale and the bank has not resold to another party, by month.
Real Property Report Methodology
California real estate data presented by PropertyRadar, including analysis, charts and graphs, is based upon public county records and daily trustee sale (foreclosure auction) results. Items are reported as of the date the event occurred or was recorded with the California County. If a county has not reported complete data by the publication date, we may estimate the missing data, though only if the missing data is believed to be 10 percent or less of all reported data.