
California Property Reports
It’s Not a Housing Bubble. San Francisco Bay Area Housing Market in a Long-Term Market Dislocation.
San Francisco Bay Area Home Sales Sink to Lowest Level Since 2008, Median Home Price Jumps 12.8 Percent Y-o-Y to $750,000
CALIFORNIA, APRIL 5, 2017 – February 2017 San Francisco Bay Area home sales, including condominiums, fell 2.8 percent from January 2017 and were down 4.1 percent from February 2016.
“February San Francisco Bay Area home sales were the lowest of any month since February 2008, the middle of the sub-prime mortgage crisis,” said Madeline Schnapp, Director of Economic Research for PropertyRadar. “February 2017’s dismal results reflect the trend of low affordable housing inventory and high prices depressing sales.”At the county level, sales were down double digits from last year in four of the region’s eight counties. Marin and San Mateo counties posted the largest year-over-year declines of 13.7 and 12.4 percent, respectively.
At the county level, sales were down double digits from last year in four of the region’s eight counties. Marin and San Mateo counties posted the largest year-over-year declines of 13.7 and 12.4 percent, respectively.
“Double-digit home sale declines in Marin and San Mateo counties reflect their median prices topping $1 million,” noted Schnapp. “It’s no wonder headlines are dominated by stories of millennial homebuyers wanting out.”San Francisco Bay Area Home Sales Summary by County
San Francisco Bay Area Home Sales Summary by County
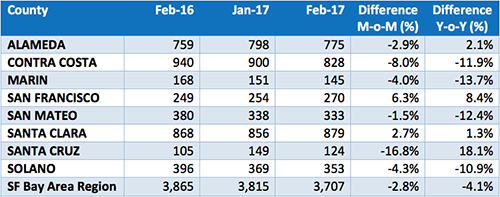
Source: PropertyRadar, 2017
The San Francisco Bay Area February median home price (single-family residence) was $750,000, up 7.9 percent from $695,000 in January 2017 and up 12.8 percent from $665,000 a year earlier.
“Prospective buyers, especially millennials, are seeing red, literally,” said Schnapp. “When we examine heatmaps of home values in the San Francisco Bay Area counties, large swaths are color-coded red, indicating values north of $2 million.”
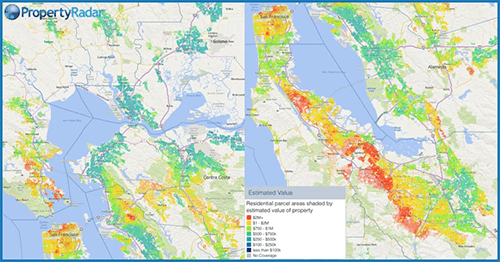
Seeing red. PropertyRadar’s heatmap of home values visualizes the affordability problem. Red indicates property values greater than $2 million while gold indicates property values in the $1-to-$2 million range.
Since February 2016, median prices were up in six of the eight counties in the Bay Area. San Mateo County was home to the highest annual price increase of 22.7 percent followed by Alameda County with an annual gain of 13.0 percent. Median prices fell in San Francisco and Marin counties lower by 2.9 and 3.4 percent, respectively. In four of the eight Bay Area counties, Marin, San Francisco, San Mateo and Santa Clara, median prices topped $1 million.
San Francisco Bay Area Median Price Summary by County (Single Family Residence)
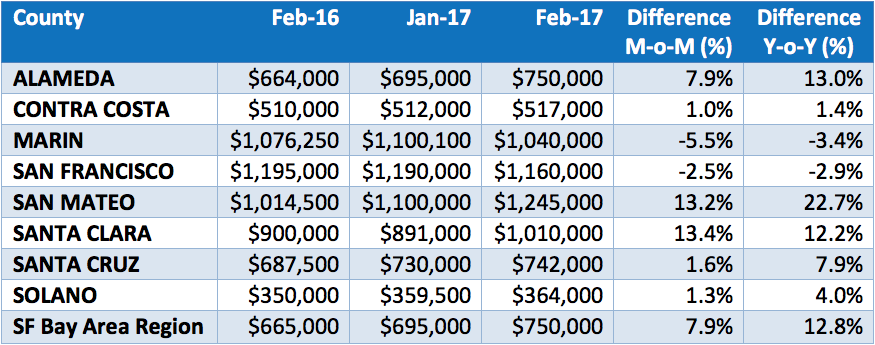
Source: PropertyRadar, 2017In four Bay Area counties, median prices have exceeded their prior peaks. In San Francisco, San Mateo, and Santa Clara counties, median prices surpassed $1 million and are higher than their prior peaks by 27.1, 35.5, and 24.4 percent, respectively. By comparison, Southern California median home prices in all but Orange County remain well below their prior peaks.
San Francisco Median Prices by County Compared to Prior Peak
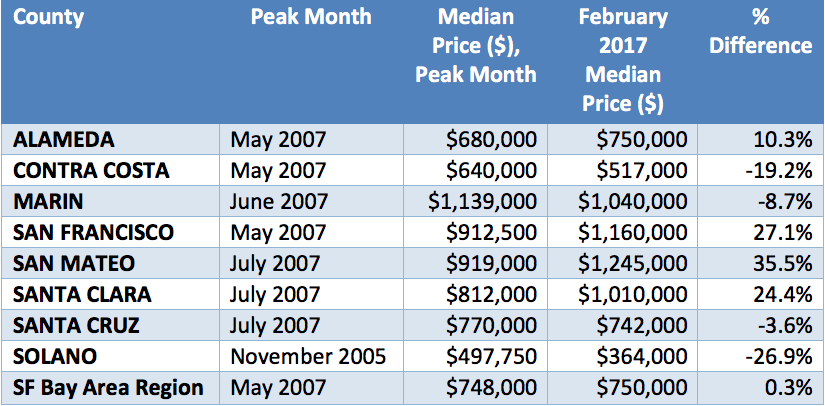
Source: PropertyRadar, 2017

Is it a Housing Bubble?
]“News of soaring prices amidst weak sales is fueling speculation that the San Francisco Bay Area housing market is a housing bubble about to pop,” said Schnapp. “It’s not a housing bubble. It’s a market dislocation caused largely by government policy.”
"A housing bubble requires both an unwarranted surge in prices followed by a massive selloff," said Schnapp. "Today's high prices are due to a combination of factors. Demand is being fueled by market stimulus in the form plentiful jobs and government-backed low-interest, below market rate loans that require little down. Supply constraints are coming from burdensome regulations on new building. A massive selloff -- a housing bubble bursting -- is unlikely because a regulatory change in 2009 means that even if consumers default on their loans, banks will now sit on inventory rather than foreclose and sell like they did in 2008."
“California’s housing problem boils down to bad government policy. Local, state and federal housing regulations have made it all but impossible for builders to meet housing demand in California’s growing economy,” said Schnapp. “Conceptually the solutions to California’s affordability crisis are simple, but politically we should expect the current situation to continue for the foreseeable future.”

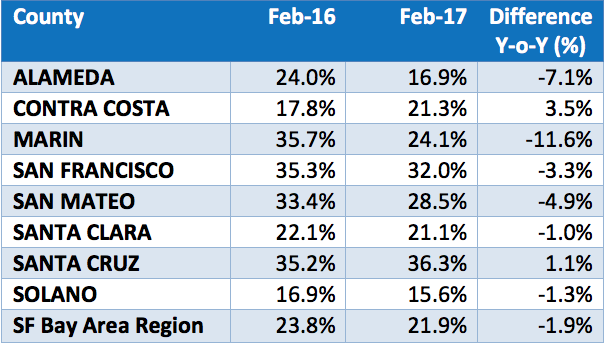
Curious Cash Sales
Cash sales of Bay Area homes in February 2017 fell 11.6 percent from a year earlier but remained high by historic standards. Cash sales were 21.9 percent of total sales.
“The historic norm for cash sales is 5 to 6 percent of total sales,” said Schnapp. “At 21.9 percent of total sales, cash sales remain abnormally high and are an important part of the real estate market. Current levels suggest there is still plenty of demand from a certain class of investors and cash-rich buyers seeking a place to park cash.”At the county level in the Bay Area, cash purchases as a percent of total sales were lower this year relative to last in seven of the eight Bay Area counties and varied considerably across the region. Solano and
At the county level in the Bay Area, cash purchases as a percent of total sales were lower this year relative to last in seven of the eight Bay Area counties and varied considerably across the region. Solano and Alameda counties had the lowest levels of cash sales at 15.6 and 16.9 percent of total sales, respectively while San Francisco and Santa Cruz counties had the highest level of cash sales at 32.0 and 36.3 percent of total sales, respectively.
“Cash sales were surprisingly high in Santa Cruz County in February,” said Schnapp. “We suspect that the greater availability of less expensive homes within commute distance of Silicon Valley is an attractive place to park cash. Cash sales are also high in inland rural areas such as Fresno and Kern counties (cash sales in February 2017 were 27.7 and 24.8 percent of total sales, respectively) where median prices are lower and return on investment higher.”
San Francisco Bay Area Cash Sales as a Percent of Total Sales by County
Source: PropertyRadar, 2017
“Unfortunately for California, years of housing policies failing to address affordability and new-home development have resulted in high home prices and depressed sales with no end in sight,” said Schnapp. “Compare that to China which recognized that affordable housing was critical to its economy. Since 2015, China has invested $236 billion and added 18 million affordable housing units to assist families priced out of urban markets. Policies that make it easier for investors and builders to provide homes at reasonable prices will go a long way towards sustaining California’s economic growth to benefit all of its citizens, not just the wealthy.”
San Francisco Bay Area Home Sales (8-County Region)*
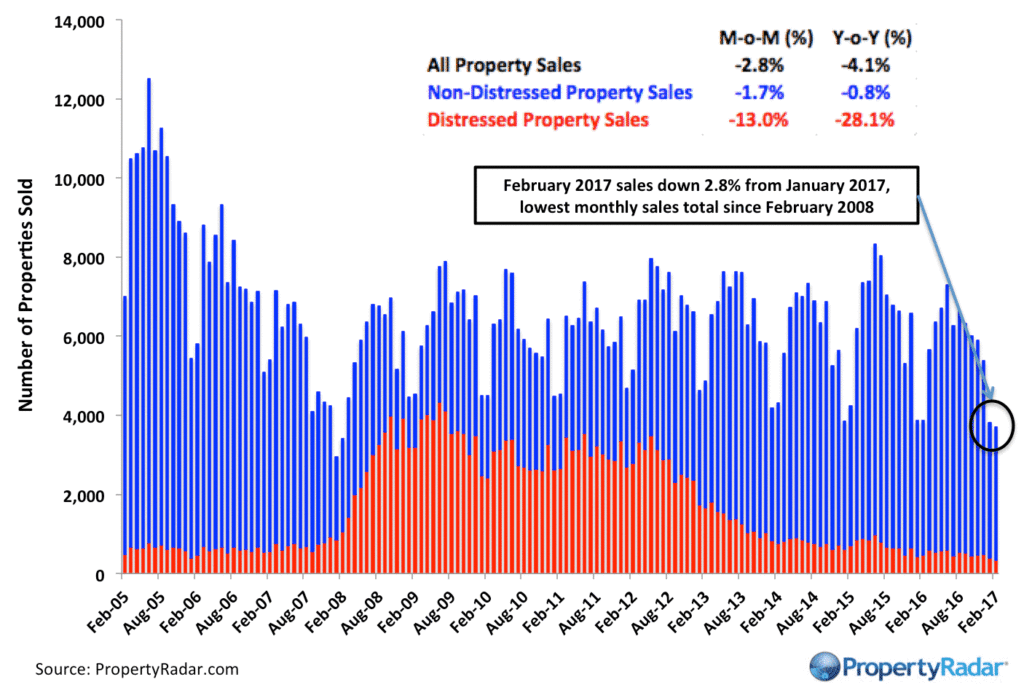
San Francisco Bay Area Home Sales – Total Single-family residence and condominium sales. Sales are illustrated by month from 2005 to current and are divided into distressed and non-distressed sales. Distressed sales are the sum of short sales, where the home is sold for less than the amount owed, and REO sales, where banks resell homes that they took ownership of after foreclosure. All other sales are considered non-distressed.
*Note: The San Francisco Bay Area is an eight county region that includes the following counties: Alameda, Contra Costa, Marin, San Francisco, San Mateo, Santa Clara, Santa Cruz, and Solano. Previous San Francisco Bay Area home sales and median price reports did not include Solano and Santa Cruz counties.
San Francisco Bay Area Year-over-Year Home Sales
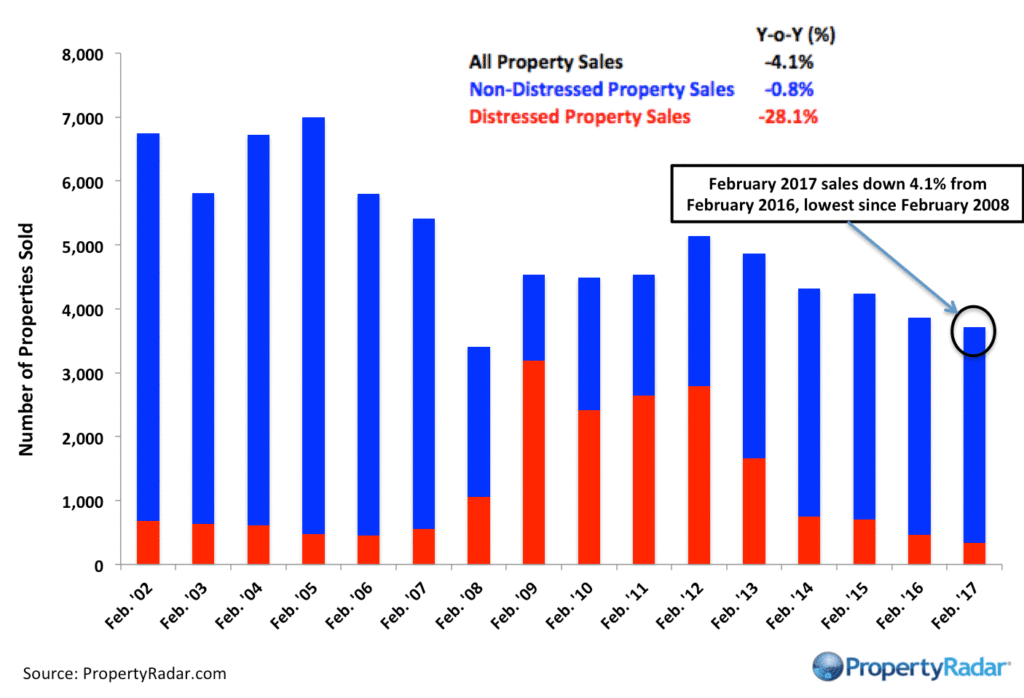
San Francisco Bay Area Year-over-Year Home Sales - Single-family residences and condominiums sold during the same month for the current year and prior years divided into distressed and non-distressed sales.*Note: The San Francisco Bay Area is an eight-county region that includes the following counties: Alameda, Contra Costa, Marin, San Francisco, San Mateo, Santa Clara, Santa Cruz, and SolanoPrevious San Francisco Bay Area home sales and median price reports did not include Solano and Santa Cruz counties.
San Francisco Year-to-Date Home Sales (January and February Combined)
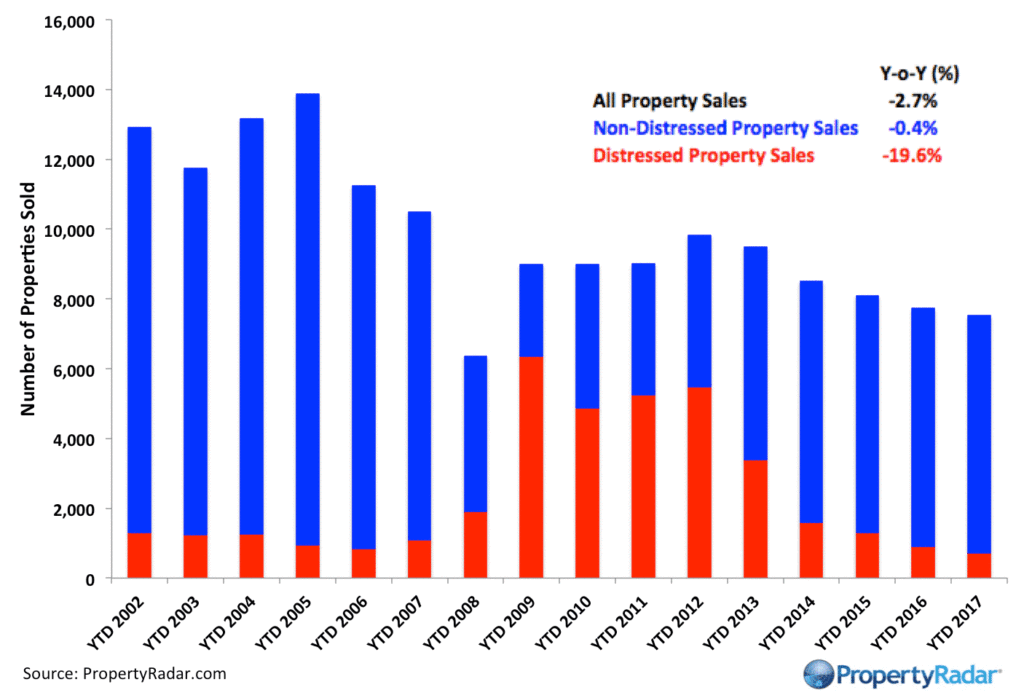
San Francisco Bay Area Year-to-Date Home Sales – The sum of January and February sales of single-family residences and condominiums for the current year and prior years divided into distressed and non-distressed property sales.
*Note: The San Francisco Bay Area is an eight-county region that includes the following counties: Alameda, Contra Costa, Marin, San Francisco, San Mateo, Santa Clara, Santa Cruz, and Solano
Previous San Francisco Bay Area home sales and median price reports did not include Solano and Santa Cruz counties.
San Francisco Bay Area Median Home Prices (Year-over-Year February Comparisons)
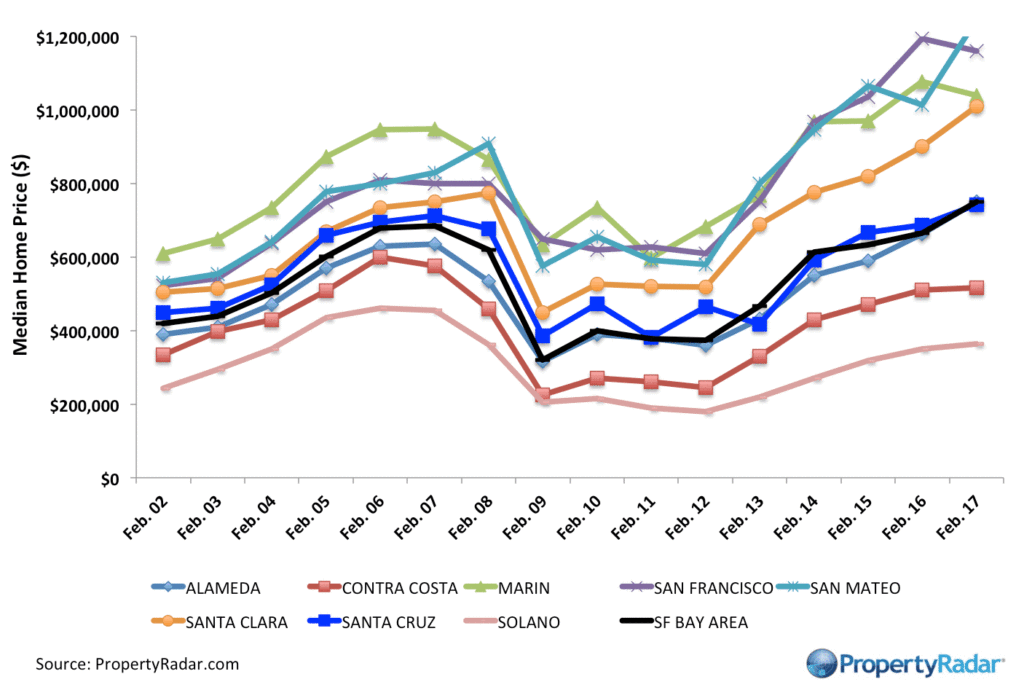
Median Sales Price – Median sales price of a single-family home by county in the eight San Francisco Bay Area counties (Alameda, Contra Costa, Marin, San Francisco, San Mateo, Santa Clara, Santa Cruz and Solano).
PropertyRadar Report Methodology
California real estate data presented by PropertyRadar, including analysis, charts, and graphs, is based upon public county records and daily trustee sale (foreclosure auction) results. Items are reported as of the date the event occurred or was recorded with the California County. If a county has not reported complete data by the publication date, we may estimate the missing data, though only if the missing data is believed to be 10 percent or less of all reported data.
About PropertyRadar
With a mission to make targeted local marketing easy, PropertyRadar is a leading property intelligence and direct marketing platform for Investors, Realtors®, and Real Estate Professionals who desire to leverage enhanced public records data to grow their business.
Over 10,000 Realtors®, Investors, and Real Estate Services Professionals have turned to PropertyRadar in CA, AZ, NV, OR & WA to discover market opportunities and connect with their prospects.
PropertyRadar (previously known as ForeclosureRadar) is a web-based subscription service providing the leads, data, analysis, marketing, alerts, and automation needed to find opportunities, reduce risk, and increase productivity.